
Peeking Into The Future Thru Futures - Commitment Of Traders This Week
Following futures positions of non-commercials are as of July 30, 2019.
10-year note: Currently net short 383.8k, up 3.7k.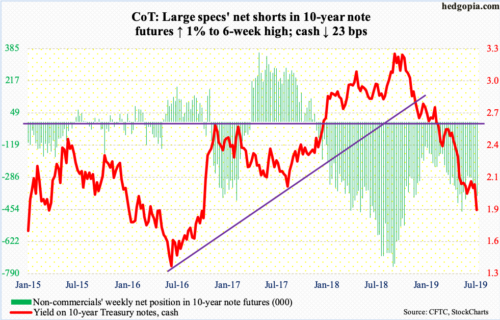
In the wake of Wednesday’s FOMC meeting in which the fed funds rate was lowered by 25 basis points but the forward guidance was not as dovish as markets wanted, Fed Chair Jerome Powell drew a lot of flak from the sell-side for delivering a ‘mixed and confusing’ message. Ahead of the meeting, fed funds futures were pricing in another 25-basis-point cut in September and possibly another in December. Post-meeting, expectations changed to a cut in either September or October. Markets adjusted after Mr. Powell suggested in the post-meeting press conference that policymakers were not embarking on a long rate-cutting campaign. Then came President Donald Trump’s Thursday tweet announcing he would slap a 10 percent tariff on a further $300 billion in Chinese imports beginning September 1. Futures readjusted. Traders now expect a 25-basis-point cut in both September and October, with a September (17-18) cut looking like a slam dunk. For the week, the 10-year Treasury yield declined 23 basis points to 1.86 percent – the lowest since November 2016. The message coming from the long end of the curve does not bode well for the economy.
The Fed has a juggling act in hand. Between now and the next meeting, markets will be all ears to what the likes of Mr. Powell, Richard Clarida, vice-chair, and John Williams, New York Fed president, say – or don’t say. The longer these policymakers try to push back on markets’ aggressive rate cut views, the higher the odds of ‘buyers on strike’ in equities. In the past, Janet Yellen-, Ben Bernanke- and Alan Greenspan-led Fed believed in the virtues of wealth effect. The current Fed is no exception. We will soon find out what their pain threshold is. Is it the S&P 500 large cap index down single digits or double digits?
30-year bond: Currently net short 32.5k, down 9.1k.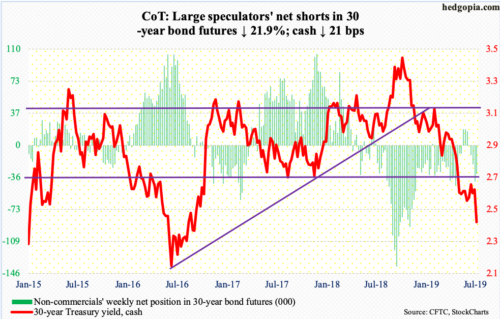
Major economic releases next week are as follows.
Monday brings the ISM non-manufacturing index (July). June was down 1.8 points month-over-month to 55.1, matching the low from July 2017.
JOLTS job openings (June) are on tap for Tuesday. In May, non-farm job openings were down 49,000 to a seasonally adjusted 7.32 million. The all-time high of 7.63 million was reached last November.
The producer price index (July) comes out Friday. June producer prices rose 0.1 percent m/m and 1.7 percent year-over-year. Core PPI was unchanged in June and increased 2.1 percent in the 12 months to June.
Crude oil: Currently net long 536.5k, down 10.5k.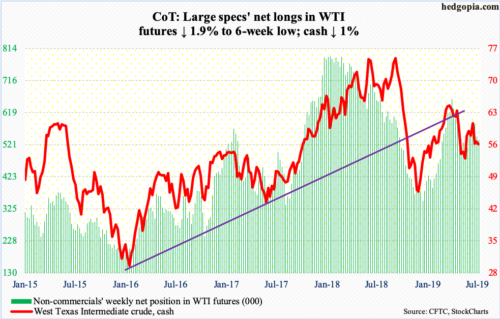
Wednesday’s intraday high of $58.80/ounce fell a tad shy of testing trend-line resistance from last October. Thursday, sellers came out of the woodwork in droves, when the cash ($55.66) fell 7.9 percent, with the session low of $53.59 finding support on a trend line from last December. A breach could expose the crude to $50-51, which bulls defended two months ago. If things stabilize here, they would love to once again go after the aforementioned trend-line resistance. This week, a weekly spinning top showed up, which followed last week’s long-legged doji.
For the week of July 26, US crude production increased 900,000 barrels per day to 12.2 million bpd. This essentially takes production to before Hurricane Barry hit. During the week, stocks of crude, gasoline and distillates all fell – down 8.5 million barrels, 1.8 million barrels and 894,000 barrels to 436.5 million barrels, 230.7 million barrels and 135.9 million barrels respectively. Crude imports dropped 365,000 bpd to 6.7 mbpd. Refinery utilization edged down one-tenth of a percentage point to 93 percent.
E-mini S&P 500: Currently net long 62.5k, up 8.2k.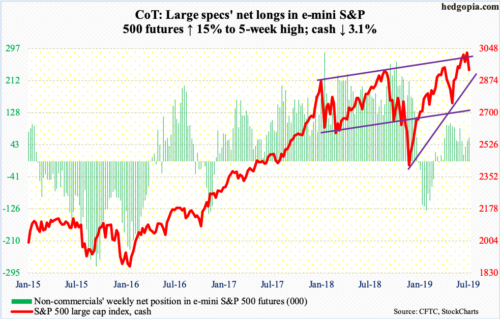
In the week to Wednesday, US-based equity funds took in $3.6 billion (courtesy of Lipper), as did three S&P 500-focused ETFs. SPY (SPDR S&P 500 ETF), VOO (Vanguard S&P 500 ETF) and IVV (iShares Core S&P 500 ETF) gained a combined $3.5 billion (courtesy of ETF.com). In the same week, money-market assets dropped $5.5 billion to $3.28 trillion – first down week in 15 (courtesy of ICI). From bulls’ perspective, this is all good, except this took place in a down week. The cash (2932.05) fell 3.1 percent for the week.
Bears succeeded in pushing the S&P 500 below 2950s-60s, which the index broke out of early July. Shorter-term moving averages are rolling over. The weekly in particular remains overbought, and several momentum indicators have turned lower. Immediately ahead, it is just a matter of which support level bulls will step up to and defend. The 50-day (2928) was breached intraday Friday but saved by close. Next comes trend-line support from last December’s lows around 2850s, followed by 2800-plus. The latter goes back to March last year and has proven to be an important price point.
Euro: Currently net short 54k, up 15k.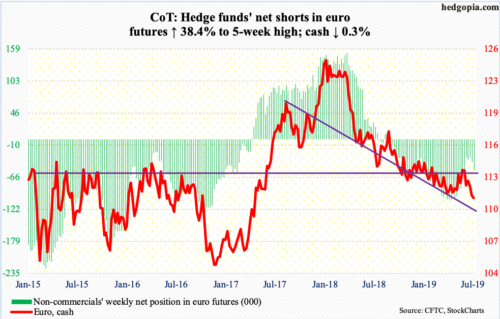
In the wake of easing in the US, an ECB cut in September’s Governing Council meeting is looking probable. Last week, the bank said it expects its key interest rates to remain at their present or lower levels at least through the first half of 2020, adding it was examining options if additional measures to stimulate the eurozone economy were needed.
The cash ($111.06) fell 0.7 percent on Wednesday, when the Fed announced its decision, and another 0.4 percent intraday Thursday to $110.27 before bids showed up to end the session up 0.1 percent. As recently as June 24, the euro tagged $114.06. There is still room for weekly indicators to continue lower before entering oversold territory. Bulls cannot afford to lose $111.
Gold: Currently net long 254.4k, up 3.1k.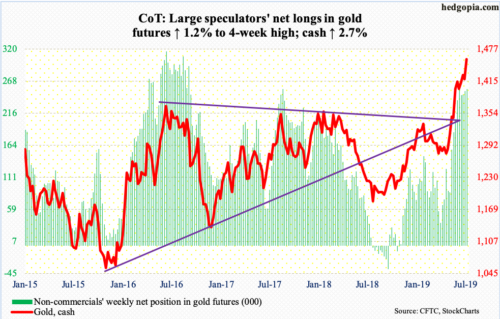
Since late June, the cash ($1,457.50/ounce) has consistently found sellers at $1,440s-50s. This preceded a breakout six weeks ago at $1,350s-60s. This week’s action was a little different, with gold closing out the week near its highs.
Throughout this latest consolidation, both GLD (SPDR Gold ETF) and IAU (iShares Gold Trust) saw positive flows. In the week ended Wednesday, GLD gained $53 million and IAU $291 million (courtesy of ETF.com). This was GLD’s 11th positive week and IAU’s 6th in seven. Non-commercials continue to hold massive net longs.
Gold bugs obviously hope the latest sideways action eventually leads to a breakout. That said, the longer this continues, with each passing week, risks rise of rising frustration among the new longs. If so, breakout retest will be crucial.
Nasdaq 100 index (mini): Currently net long 25k, up1.6k.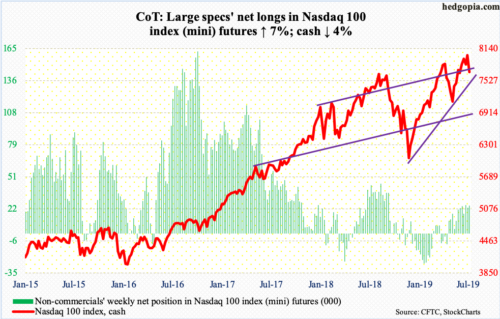
Volume decidedly picked up both Wednesday and Thursday as selling accelerated on the cash (7692.80). Ironically, in the week through Wednesday, QQQ (Invesco QQQ Trust) attracted $1.8 billion – its largest weekly haul in five (courtesy of ETF.com). For now, bears have wrested control of momentum. Bulls Friday were able to defend the 50-day (7657), but right here and now they are likely to be on the defensive. A trend line from last December draws to 7300.
Russell 2000 mini-index: Currently net short 80.4k, down 6.6k.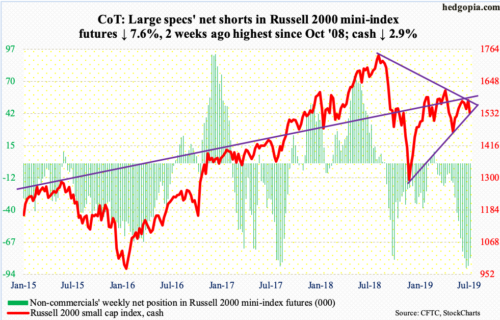
The cash (1533.66) peaked as far back as August last year, at 1742.09. A falling trend line from that high consistently denied rally attempts, including several times last week and this Monday. Tuesday, the resistance gave away, followed by a test Wednesday of crucial ceiling just north of 1600. Bears used this as an opportunity to – once again – get active. Until this resistance is taken out, small-cap bulls will be on the back foot, with traders hesitating to aggressively take on risk.
There is trend-line support from last December’s lows at 1525. At 1520, the 200-day lies around there as well. They were both tested Friday – successfully. It is a must-save.
In the week ended Wednesday, IWM (iShares Russell 2000 ETF) and IJR (iShares Core S&P Small-Cap ETF) gained $428 million and $462 million respectively (courtesy of ETF.com). Hopefully for bulls, this week’s small-cap action does not discourage new inflows.
US Dollar Index: Currently net long 30.3k, up 1.2k.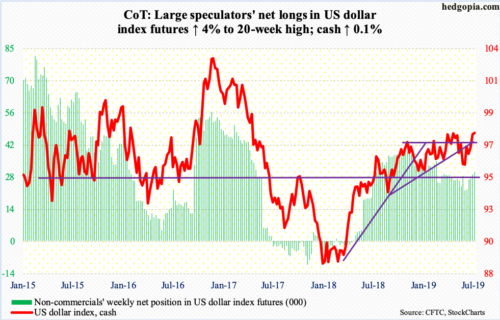
Intraday Thursday, the cash (97.85) reached a 27-month high of 98.70, but bulls were unable to hang on to it, closing down 0.11 to 98.14. This was preceded by nine straight up sessions. When it was all said and done, a shooting star showed up on the weekly. The daily is itching to go lower. Nearest support lies at 97.50s.
VIX: Currently net short 144.3k, up 12k.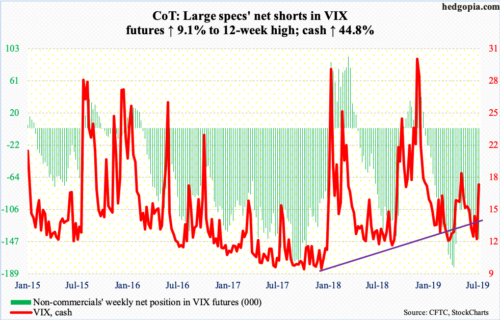
Until this week, the cash (17.61) was bound by a falling trend line from last December when VIX peaked at 36.20 intraday. This resistance is now gone.
On the weekly, there is plenty of upside left. The daily could be different. Merely seven sessions ago, the volatility index touched 11.69 just above the daily lower Bollinger band. VIX this week rallied above both the 50- and 200-day – respectively at 15 and 17. Volatility bulls defended the latter Friday, but at the same time were unable to hold on to the intraday highs; VIX rallied as high as 20.11, but only to reverse hard. In the past, a spike reversal is followed by downward pressure, so it bears watching next week.


