
New Security Selection Process In Action
Implementing Our Updated Security Selection Method
In a recent post (Refining Our Security Selection Process), described a recent change to our security selection process:
We had already determined that, among our top-ranked names, securities that can be hedged against >9% declines over the next 6 months with optimal puts tend to significantly outperform those that can't be hedged that way. We'd been calling those "AHP" ("Also Hedgeable with Puts") for short. What we've done recently is drill down a bit further, looking at which securities were also hedgeable against even smaller declines with optimal puts.
We've been tracking a ton of data related to this since mid-2017, some of which is summarized in this screen capture from our admin panel which I'll explain below.
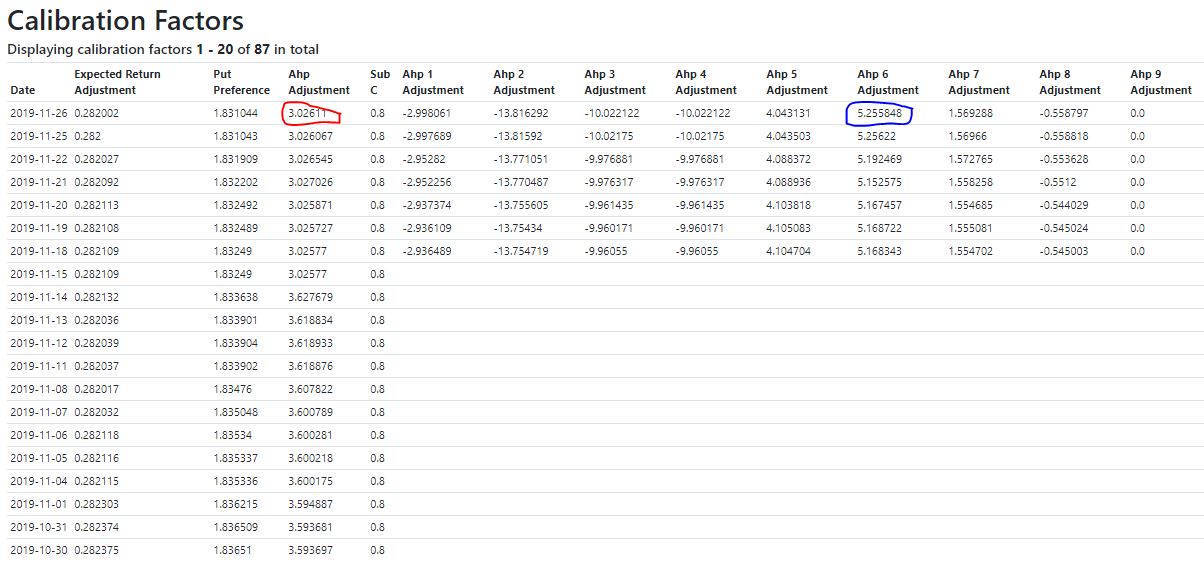
The column circled in red shows the average out-performance of our top names that could be hedged with optimal puts against >9% declines over those that couldn't be hedged that way over the next ~6 months. As you can see, there's about a 3% performance advantage there. The column circled in blue shows the average out-performance over those AHP names of securities that could be hedged against >6% declines over the next ~6 months with optimal puts. As you can see, those AHP6 names outperformed the regular AHP names by about 5.26%.
As I mentioned in my previous article, we didn't have a large sample size for the AHP6 names - only about 86 of them, over a couple of years - so I was initially on the fence about incorporating that data. But I decided to do so for a few reasons:
- It has an immediate benefit of lowering hedging costs in our hedged portfolios (more on this below).
- It enables us to dramatically increase the performance data we have on AHP6 names: in about 6 months, we will have more than doubled our data on them.
- We'll continue tracking data for our previous method of selecting top names, and use the results from both methods to continuously update our calibration factors. Ultimately, that data (plus data on other factors we're collecting but haven't implemented yet) will determine how our selection method evolves from here.
Old Method Versus New Method
Here's a look at our top ten names from Tuesday, calculated using our old method:
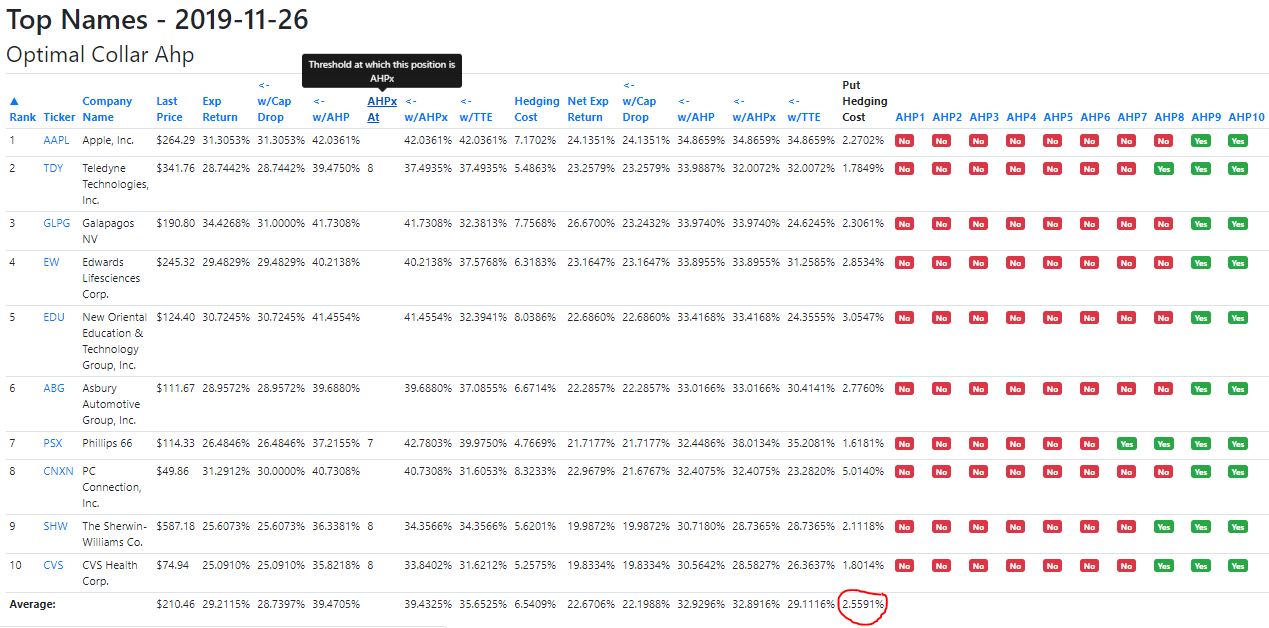
Our top 10 names, calculated the old way, as of Tuesday's close were Apple (AAPL), Teledyne Technologies (TDY), Galapagos (GLPG), Edwards Lifesciences (EW), New Oriental Education & Technology (EDU), Asbury Automotive Group (ABG), Phillips 66 (PSX), PC Connection (CNXN), Sherwin-Williams (SHW), and CVS Health (CVS). All of these securities were hedgeable with optimal puts against >9% declines over the next several months, but none was hedgeable against >6% declines that way. Note the number circled in red on the bottom, toward the right: That's the average cost, as a percentage of position value, of hedging each name against a >20% decline over the next six months with optimal puts: ~2.6% of position value.
Now here's what the top 10 calculated the new way looked like on Tuesday:
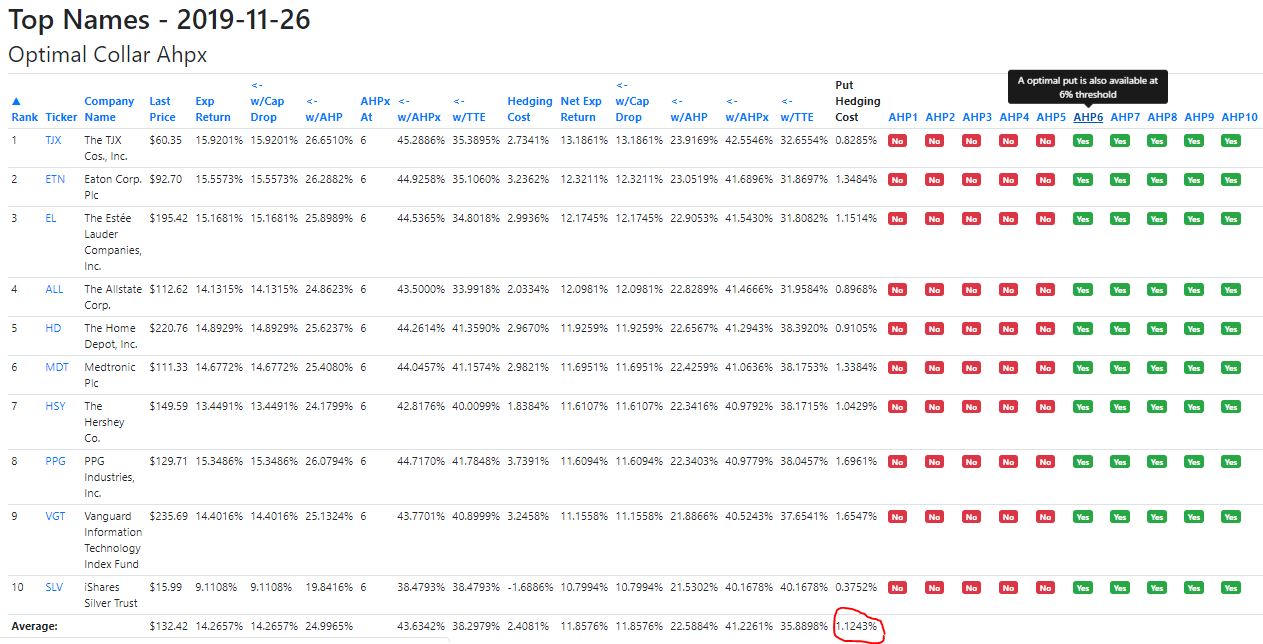
The top 10 names calculated the new way were TJX (TJX), Eaton (ETN), Estée Lauder (EL), Alstate (ALL), Home Depot (HD), Medtronic (MDT), Hershey (HSY), PPG Industries (PPG), the Vanguard Information Technology Fund (VGT), and another ETF, the iShares Silver Trust (SLV). All of these were hedgeable against >6% declines with optimal puts, as the green boxes in the "AHP6" column indicate. Note that the average hedging cost circled in red here is less than half as high as the top 10 names calculated the old way: 1.12% of position value.
Iteratively Improving Performance
My prediction is that, among top names calculated the new way, we will have fewer positive and negative performance outliers, but time will tell. Either way, our system will be iteratively improving the performance of its security selection method, as returns from both the new way and old way of ranking our top names will be used to update our calibration factors.
How You Can Use This In Your Own Investing
If you are struggling to decide between two names in your own investing, you can check to see if either is hedgeable against a >9% decline over the next several months with optimal puts. If both are, you can test lower decline thresholds for each of them, and give a preference to one if it is also hedgeable against >7% or >6% declines. I gave an example of this in my previous article; here I demonstrate it for ALL and PGR with a few taps of the Portfolio Armor iPhone app in the (silent) 30-second video in this tweet.
A Request For Your Feedback
The security selection method I referred to above is part of our hedged portfolio approach, which I described in another recent post. That approach, in a nutshell, is to buy and hedge a handful of securities that our system suggests have the potential for high returns over the next several months, net of their hedging cost. We've had some interest recently in packaging this approach as an ETF, or in another form. Would you mind sharing your thoughts on that in this one-minute survey? Thanks a lot.
I'd be happy to answer any questions you have in the comments.


