
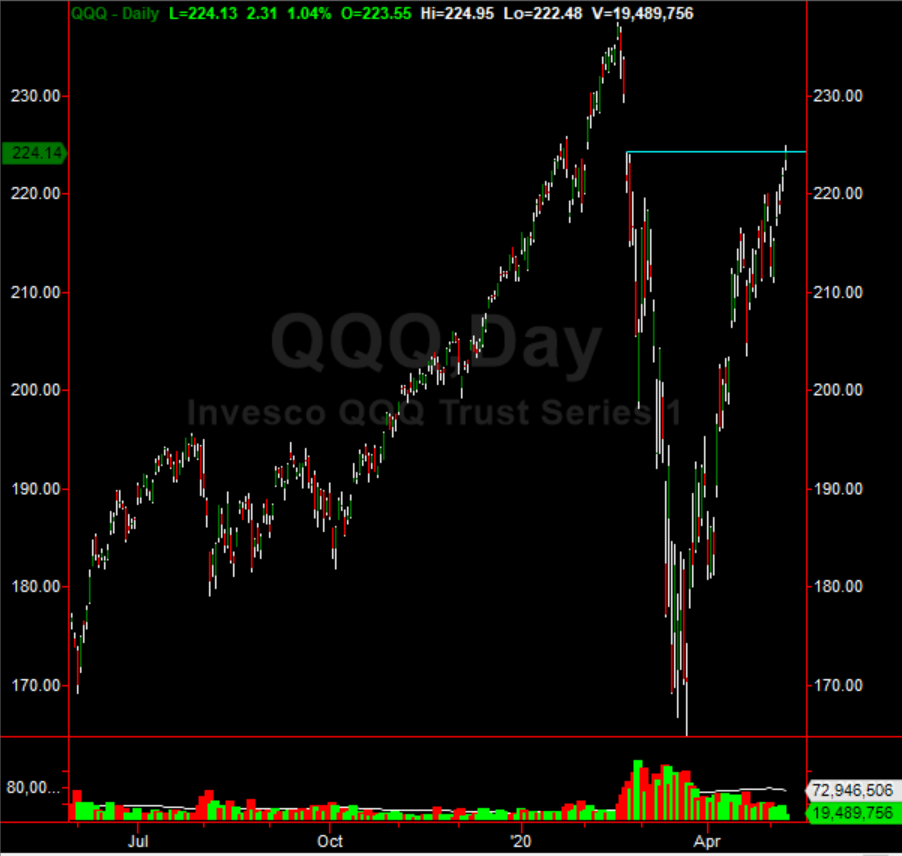
Nasdaq Technical Analysis: Gap Window
The Nasdaq 100 ETF (QQQ) is higher again today, now positive on the year and only 5% from all-time highs. However, investors and stock traders should be aware technical resistance is being hit today. Nasdaq technical analysis shows us the ETF is hitting gap window. Gap window represents the opening price of the Nasdaq 100 ETF hit after the epic gap lower on February 21st, 2020. This will be resistance on the chart and may signal a pullback next week in the ETF.
Nasdaq technical analysis signals a sell next week as swing traders accumulate a short position here. Many technicians continue to point to the fact that the economy lost 20.5 million jobs in the last month and has a 15% unemployment rate. The markets are pricing in a V-shaped recovery but almost every economist is signaling that is extremely unlikely. While the Federal Reserve has backstopped this market partially, it is foolish to think it cannot pull back 10-20% from current levels.
(Click on image to enlarge)
Disclosure: None.


