
Mid-Cap Growth Picking Up
In the five days ending last Friday, by far the best performing major US index ETF in our Trend Analyzer was the Micro-Cap ETF (IWC) with a 1.65% gain. That also places it in the top spot in terms of YTD performance. In spite of that outperformance, it finished last week as one of just three ETFs in the group that is below its 50-DMA.
Up another 0.59% so far today, IWC is continuing to close in on getting back above its 50-DMA. While micro-caps have done well, other small-cap indices like the Russell 2000 ETF (IWM) and the Core S&P Small-Cap ETF (IJR) have done far worse. Yet even worse still were S&P 500 Mid-Cap ETFs (IJH and MDY), which found themselves at the bottom of the list in terms of five-day performance.
But not all mid-cap indices were the biggest losers last week. The broader measure of the mid-cap space, the Russell Mid-Cap ETF (IWR)—which tracks the 800 smallest stocks in the Russell 1000 whereas the S&P mid-cap ETFs track the S&P 400—was likewise lower over the five days ending last Friday, but its loss was much smaller at 18 bps versus the over 1% decline for IJH and MDY.

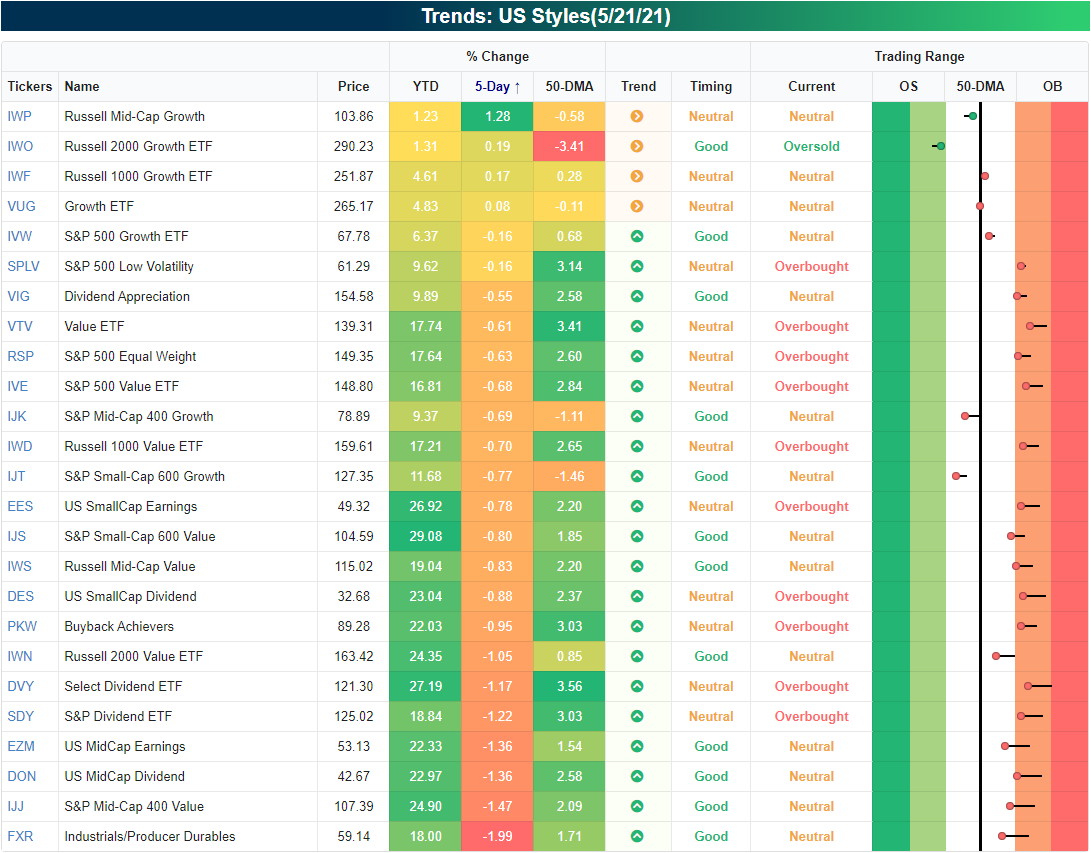
Breaking that down further, growth was the key to this stronger performance for the Russell mid-caps. The Russell Mid-Cap Growth ETF (IWP) saw a standout performance with a 1.28% gain last week compared to a 0.83% decline in the value counterpart, the Russell Mid-Cap Value ETF (IWS).
Other growth ETFs like the Russell 2000 Growth ETF (IWO), Russell 1000 Growth ETF (IWF), and the broader Growth ETF (VUG) were the only other tickers in the US Styles grouping of our Trend Analyzer that were in the green last week, though, they all were up by a full percentage point.
Again, in spite of also tracking mid-caps, the S&P’s ETF also underperformed, with the S&P Mid-Cap Growth ETF (IJK) falling 0.69%. One possible reason for the outperformance of the Russell Mid-Cap Growth ETF could be a rotation into what has been this year’s losers. Although it outperformed in the past week, IWP is still the worst performer on the year with other growth ETFs not far behind.
Below we show the ratio of Russell Mid-Cap Growth (IWP) versus the value counterpart (IWS) and the broader Russell 1000 (IWB) over the past five years. When the line is trending higher it indicates mid-cap growth is outperforming, and vice versa when the line is trending downward. In the first half of last year, growth took off relative to value, but from the second half of 2020 into early 2021, that outperformance trailed off as the line moved sideways.
Since February, there has been a sharp reversal with two significant legs lower, with the most recent one lasting from the end of April through earlier this month. The recent bout of strength from mid-cap growth in the past week is basically just a blip within those declines, but it does mark a bounce from around the past few years' trend in the ratio. It is a similar story relative to the broader Russell 1000, as well.

Taking a look at IWP’s chart, last week’s solid performance appears to be carrying into this week with IWP up another 1.15% today, which puts it on pace to move back above its 50-DMA. But even though there has been strength in the very short-term, IWP’s longer-term trend still has plenty of room for improvement.
The 50-DMA has been trending sideways as the ETF has been in consolidation for most of the year since hitting a 52-week high in February. Currently, at its 50-DMA, IWP is right in the middle of that consolidation range.

Disclaimer: For more global markets and macroeconomic coverage, make sure to check out Bespoke’s Morning Lineup and nightly Closer notes, as well as our ...
more

