
Market Rebound And Volatility: Is It Time To Trade?
Short-term traders call volatility their friend. There is a reason why. The up and down movement of stock prices makes it difficult to make money by buying and holding for extended periods unless the market assumes a sustainable upward trend. As such, when markets are relatively choppy like they are now, investors try to capitalize on volatility by trading short-term.
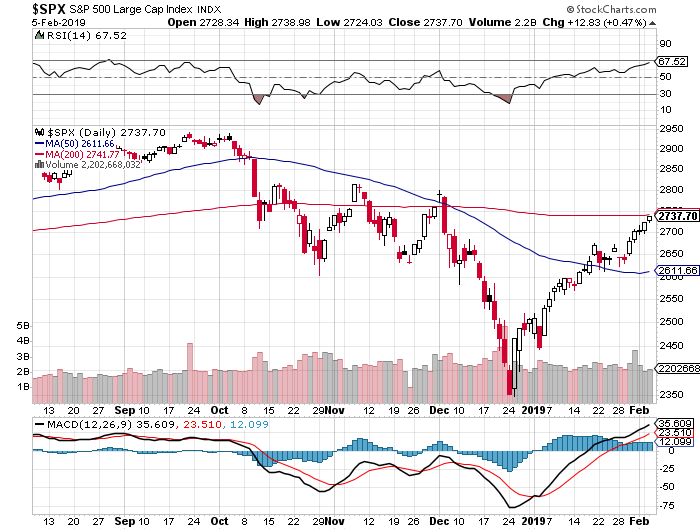
Nonetheless, as more companies continue to report the December quarter results, investors will be expecting the S&P 500 Index, the Dow Jones Industrial Index and Nasdaq Composite to post some gains. In fact, looking at the S&P 500 Index (SPX) chart, the SPX and its counterparts have been on an upward movement since the post-Christmas period.
The question will be whether those gains will be sustainable for the next few months given the overall market outlook. Currently, the results pouring in seem to have calmed the market a bit. However, this does not completely wipe out short-term trading opportunities.
So, how do you trade the current market volatility?
Investors will be looking for opportunities to capitalize on the short-term gains witnessed during the earnings season without committing to owning the stock on a long-term basis. One way of achieving this is through the regular broker, but this might require a substantial financial outlay. As such, some traders will be looking for alternative ways.
This is where stock CFDs trading are likely to come in handy as they offer investors more opportunities to trade the volatility without necessarily having to commit a significant level of their capital. In addition, there are fewer fees involved. In a recent Plus500 review, it is revealed that the CFD broker does not charge dealing commissions, which a trader pays when trading via a traditional stockbroker. Most CFD brokers do not charge additional fees but only rely on the spread for profits, which is why most traders outside of the U.S. continue to choose them ahead of traditional stockbrokers. Some are also attracted by the leverage provided, which means that traders can trade in high volumes.
The VIX shows market volatility has declined significantly but is still above last year’s average.
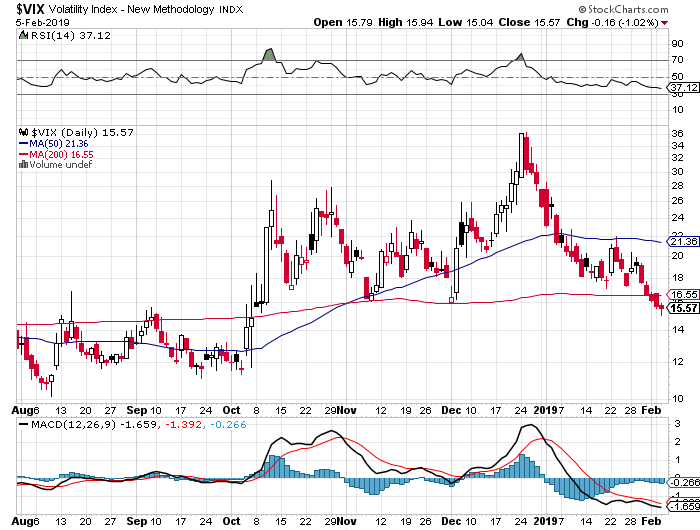
The CBOE Volatility Index (VIX) shows that even though volatility has subsided over the last six weeks, it is still pretty much above last year’s average levels, which means that the markets are not off the hook yet.
As demonstrated on the daily chart below, the VIX averaged about 12.5 through October last year before it spiked in November following the US midterm elections. Therefore, at the current level of about 16 points, the VIX is relatively higher.
It will also be interesting to see what happens to the index should uncertainty return once all the major companies have released their most recent quarter results.
But based on the most recent US Jobs data report, things appear to be positive for now after the market created more jobs (304,000) than expected in January 2019.
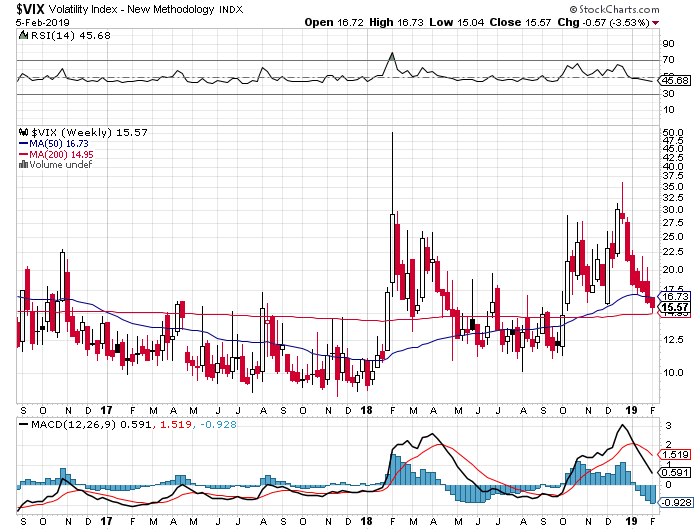
The VIX weekly chart also indicates that the current level of volatility in the market of about 15.57 is slightly above the 200-day moving average of 14.95. But it just dropped below the 50-day moving average of 16.73 this month, which means that there could be more twists and turns in the coming weeks.
And when looking at the two main technical indicators (the RSI and the MACD) as illustrated in the chart above, the RSI shows that the VIX has now crossed below the median line 50%, but it still way off the lower limit of 30%.
On the other hand, the downward momentum as demonstrated using the MACD has just crossed below zero to -0.928 (closer to -1.00), which suggests that there is little room downwards before a potential rebound ensues.
Clearly, there are interesting times to come in the market over the next few weeks and months, and short-term traders will be relishing the opportunity to capitalize on the ups and downs.
Conclusion
In summary, the market appears to have bounced back from the decline registered during the final quarter of 2018. As demonstrated using the S&P 500 Index chart, the SPX has already recouped all the declines made during December 2018 and it looks set to rally back to September 2018 highs.
The VIX also seems to be subsiding, which is potentially great news to long-term investors. However, at nearly 16 basis points it is still high compared to last year’s averages and it still remains to be seen how long the current market rally as indicated on the SPX chart will last. This means that it would probably be better to trade the market short-term for now. And while it is possible to do this using a regular stockbroker, some traders (outside the U.S.) will be looking to pounce on the market using short-term trading instruments like CFDs.
Disclaimer: The material appearing on this article is based on data and information from sources I believe to be accurate and reliable. However, the material is not guaranteed as to accuracy nor ...
more

