
Is Your Portfolio’s Performance Satisfactory?
What’s your investment portfolio’s performance? Do you know? Just 57% of U.S. adults are “financially literate,” according to a study from Standard & Poor’s titled the “2015 Global Financial Literacy Survey.” Another study by a large insurance company found that people are more frightened by planning their finances than dying. What’s wrong?
Part of the problem is structural: Fewer than half of all U.S. states require high school students to enroll in a personal finance course.
(Audio) Portfolio Report Card on a $4 Million Account for T.R.
The other problem is psychological: People are fearful when it comes to saving and investing money.
Once a person has overcome these obstacles and gotten started with their investment plan, how can they know if their investment portfolio is making progress?
The Case for Benchmarking
The concept of “benchmarking” boils down to measuring the performance of your investments against relevant yardsticks. “Relevant” is key, because measuring performance against irrelevant yardsticks will inevitably lead to irrelevant results.
For example, racing a collie against a field of greyhounds could lead observers to incorrectly assume collies are slow. On the other hand, racing each dog against its corresponding breed will result in a more accurate view of canine speed. If your collie is able to easily outrun a field of competing collies, you have a fast dog. And if he/she can’t outrun a pack of greyhounds, it’s mainly because he/she isn’t a greyhound.
Beyond choosing relevant yardsticks, the exercise of measuring investment performance should become a consistent routine for all investors. Why? Because failing to periodically measure your portfolio’s performance, either by choice or by ignorance, leads to a distorted view of satisfactory results. Moreover, just because you’re comfortable with portfolio’s results doesn’t necessarily make the results satisfactory.
Level 1 Analysis
Benchmarking your investment performance is a layered process. Layer 1 is what I refer to as the “big picture” because it examines your portfolio’s investment performance against relevant passive yardsticks using an asset weighted approach. Let’s look at an example:
Portfolio ABC
30% U.S. stocks
10% International developed stocks
40% U.S. bonds
10% Global real estate
10% Money market (cash)
Comparing the performance results of a portfolio with exposure to different asset classes (like our example of Portfolio ABC shown above) against the S&P 500 (VOO) is a common mistake. In this example, the vast majority of Portfolio ABC (70%) has non-U.S. equity exposure, which makes an all U.S. equity benchmark like the S&P 500 an irrelevant yardstick for all but Portfolio ABC’s 30% U.S. equity exposure (IWB).
Properly measured, the other assets like bonds (BOND) and real estate (ICF) should have their performance compared to relevant passive benchmarks over the exact same time frame. And together, the asset weighted returns for the passive benchmarks will explain whether portfolio’s performance has been satisfactory or unsatisfactory. Simply put, outperformance over identical time frames is good whereas underperformance isn’t.
Level 2 Analysis
Analyzing investment performance at level 2 is less “big picture” versus level 1. Why? Because level 2 analysis focuses on the performance examination of individual securities versus their respective peer group. Put another way, level 1 analysis is comparable to using a telescope whereas level 2 is comparable to using a microscope.
Below we use level 2 analysis by comparing the performance of Wal-Mart Stores (WMT) against its peer industry group, consumer staples (XLP). Over the past 10-years, Wal-Mart has gained almost +103% against a +173.10% gain for the Consumer Staples Sector SPDR ETF. In other words, Wal-Mart has badly underperformed its peer group by a whopping +70% over the past 10-years!
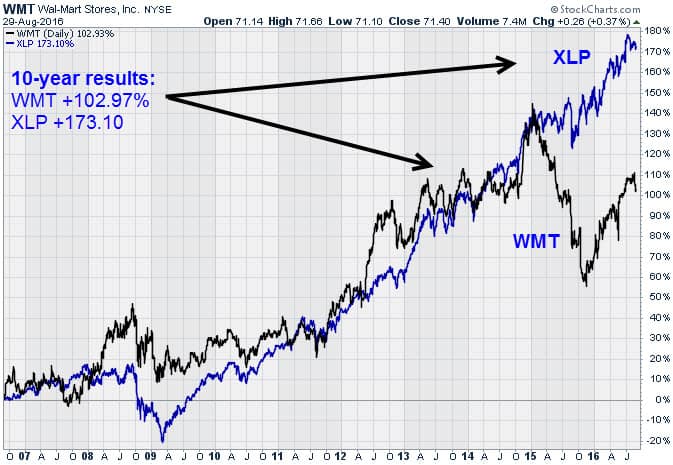
Had we failed to use level 2 analysis on Wal-Mart by simply accepting the fact that its stock has gained +102.97%, we could’ve been easily misled to conclude that Wal-Mart’s 10-year equity performance has been wine and roses. However, our level 2 analysis explicitly shows that Wal-Mart’s 10-year performance record has been substandard compared to its peers.
Because virtually all individual stocks will have a corresponding peer sector group, comparing the performance of a company’s equity performance isn’t just easier, but mandatory for all serious and truthful stockholders.
Summary
The proper way to determine satisfactory investment performance is to use relevant benchmarks over identical time frames. Level 1 analysis examines the portfolio’s asset weighted performance against passive yardsticks, whereas level 2 analysis focuses on the performance of individual securities.
Level 2 analysis can also be applied to mutual fund holdings, however, the fund’s underlying asset exposures vs. its peer group classification are far more important for correct analysis. This is a similar approach I use with the Portfolio Report Card grading system that I invented.
It’s crucial to remember that investment performance is directly impacted by your portfolio’s cost, risk, diversification, and taxes. And while performance measurement is an ultra important step, focusing exclusively on historical performance results and nothing else will tell you most of the story, but not all of it.
Disclosure: None
Disclaimer: Ron DeLegge has analyzed and graded more than $125 million with his Portfolio ...
more

