
Is The VIX/SPX Marriage Heading For The Splits?
"VIX, you got some 'splainin to do. I am hearing and seeing a lot of 'what the heck is going on with the VIX and VIX-leveraged ETFs in social media lately. What I am not seeing is a lot recognition for prudent institutional investing that has found this investor class taking advantage of deploying their hedging strategies with what would be the most optimal way to do so, via SPX options.
I say that tongue in cheek as this isn’t a new phenomenon, but it’s certainly an inexpensive way to do so given how cheap volatility has become.
In recent years and even more recent months, hedging via volatility has actually gone out of favor, seeing how the VIX committed to a great deal of down trending from 2016 into 2018. Largely, hedging by going long volatility and via .SPX options proved little more than a tax on asset manager’s long portfolio. In 2017, the mean VIX reading was 11.10; it’s lowest ever annual mean average, pretty cool huh? Where were you when volatility got crushed through 2017? Well I know where I was. I was warning some of the institutional crowd that this wouldn’t prove an advantageous hedging strategy, writing covered calls or going long volatility. And it wasn’t a good hedging strategy as 2017 also found the VIX achieving a new all-time low reading below 9 percent and doing so without any significant and sustaining upward mean retracing.
Here in 2018, there has been some strangeness, they would say, in the volatility complex. This strangeness is characterized by the S&P 500 (SPX) achieving daily record high levels…but with the VIX also rising in tandem. Strange huh? Well, not entirely if we accept the reality that is; the VIX has a negative 80% correlation with the S&P 500. So, when the S&P 500 falls, the VIX usually rises. After all, the VIX is priced from a portfolio of S&P 500 options and the futures price from the market’s expectation of where the VIX Index will settle at expiration (IV).
Institutional investors tend to buy put options to hedge their portfolios when the S&P 500 falls, thus driving up the cost of premiums leading to a higher level of the VIX. But then there is that 20% of the time that the SPX magnetizes to the VIX whereby both move down together or up together. Furthermore, again it would be warranted to recognize the prudent deployment of institutional hedging strategies that is clearly at play in 2018. The S&P 500 has seen a record number of trading days without a 5% pullback. In the minds of asset managers, this is a bit scary to accept and especially with records being set by the major averages daily, record S&P 500 RSI and bond yields starting to signal inflation ahead. The psychology suggests that deploying hedging strategies is necessary, especially with volatility being so darn cheap.
The markets have been on an unbelievable, record run and typically if the market has been on a extended bull run without a pullback of significance, institutional investors will become increasingly concerned that a correction is at-hand and they will start bidding up put options. It’s all psychology folks; the market is about psychology and/or sentiment. This type of activity regarding put options, with volume, will result in a rising VIX regardless of what the S&P 500 is doing. Another favorite activity among the institutional crowd is writing covered calls. So when reviewing 2018 and characterizing the VIX’s movement thus far, maybe it’s not so strange, but rather unforeseen. Ah, unforeseen, unexpected and especially after what was experienced through 2017 whereby the VIX seemed to do little more than decay, decay, decay. You don’t have to like it, you don’t have to appreciate it.
So when will this “strange” VIX action end and should short-VOL investors/trades be worried? That’s a tough one, but before I attempt to answer a question that I probably shouldn’t have proposed seeing as I’m authoring this article, let’s look at a couple of things. First let’s look at The VOL of VOL via VVIX. I typically like for VVIX to be below 95 or lower. The chart below of VVIX identifies what may be the start of a near-term continued decline in VVIX
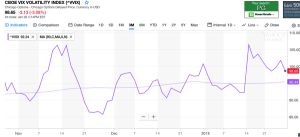
VOL of VOL tends to express itself in much the same manner as the VIX or VXST (9-day volatility) in that they have brief upticks followed by steep declines. The 90-day moving average identified by the chart of VVIX is 95.44 and on Friday VVIX closed just slightly above it. So, you know what this chart is indicating right? Exactly, not a darn thing more than an individual desires it to indicate. The volatility complex is completely reactionary and dependent on its derivative nature or construct. As such, using technical analysis proves highly ineffective, but found with luck from time to time. Having said that, if I was to use TA here I would say the duration of most VVIX spikes last for 5, 6 trading days on average before descending, which would probably line up with the activity in .SPX options and suggests further VVIX downside is in the works.
Before we move on to looking at some of the expectations for .SPX option trading coming this week, let’s look at another chart, this time using the VIX itself.
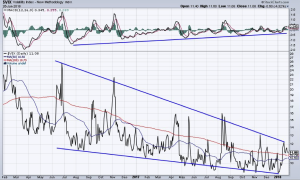
If we ignore the fact that over the last two years the VIX has dipped below and surged above the wedge channel 10 times, that looks like a pretty defined wedge. And more recently in January the chart shows that the VIX just hit the top of the channel for which it is now descending. Ten times in two years…technical analysis is not an exact science. No kidding! So maybe we go there now, to the .SPX options. As my father used to say, “I wasn’t asking ya, let’s go."
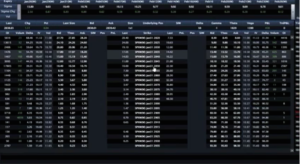
I use CBOE’s Live VOL Pro streaming service to monitor Volatility and the daily .SPX options activity. Last week Friday, tons of weekly open interest for .SPX options expired and the 31st has even more coming due. Much of the open interest was centered on SPY 2840 and 2850 whereby investors were largely selling .SPX call options.
By selling an index call the seller takes on the obligation to sell the value of the underlying index at a fixed price in the future. The S&P 500 ended Friday January 26th at 2872, 'nuff said about taxing portfolio gains. For the first four weeks of the year, the average daily trading volume in S&P 500 call options has jumped by 44%, with put options jumping 32% according to options analytics firm Trade Alert.
According to Mark Sebastian, founder of Optionpit.com, it’s very possible or probable that the open interest in .SPX is about to or has hit a temporary wall. Remember, the trade coming into the year from institutional investors has been a bullish equities trade, but one that produced a great deal more activity from hedging than in 2017. In terms of scale, the SPX options market is quite robust, with a value greater than $100 billion. A single SPX put or call option is the equivalent of $200K in stock value and largely utilized by the institutional crowd. Sebastian has taken the activity in .SPX options to conclude that the January options activity that has given rise to volatility will be “coming off” in the near-term. On Friday, we did bear witness to a modest decline in the VIX and VIX Futures. It remains to be seen if there is more decay in the VIX to come, but open interest for Monday for this coming week shows it is more probable.
We’re coming up on a big anniversary for market participants. Nearly a year ago I attempted to warn CNBC’s Pete Najarian that his long volatility hedging strategy was pointless and would prove little more than a tax on his long portfolio. OK, maybe not such a big market anniversary wink, wink. But in the article VIX Trading: Even The Pros Get It Wrong I detail my interaction with Mr. Najarian on social media. Since that time I’ve created finomgroup.com as a place for those who desire greater insight into the volatility trade, the moving parts around the volatility trade and how to trade the complex effectively. Nonetheless, here we are in 2018 and finding greater volatility at the moment, largely due to these institutional investor-types “taxing” their gains. Don’t get me wrong, I’m all for taxes, but I leave that job to the government.
That’s enough about volatility, as I don’t desire to leave people without some insight into the happenings surrounding the week ahead. There’s a good deal more economic data coming this week and it commences on Monday with Consumer Spending and Income data. It’s followed by Consumer Sentiment, Chicago PMI on Tuesday, which only serves as an appetizer to the Fed’s Rate Hike announcement on Wednesday, alongside ADP Employment. The Fed is not expected to raise rates until March so I wouldn’t be too concerned presently although investors should study the language surrounding the announcement. On Thursday we’ll see the ISM manufacturing results followed by the “big daddy” Nonfarm Payroll data on Friday. It’s a busy week and this is before we even recognize the State of the Union address on Tuesday or the plethora of earnings set to hit the tape this week. It’s gonna be a jam-packed week of exciting news headlines.


