
Invesco QQQ ETF: The Trend Is Your Friend
Invesco QQQ (QQQ) has made an impressive recovery from the March lows, and the ETF is currently trading near historical highs in spite of all the economic and social uncertainty factors creating concerns among investors.
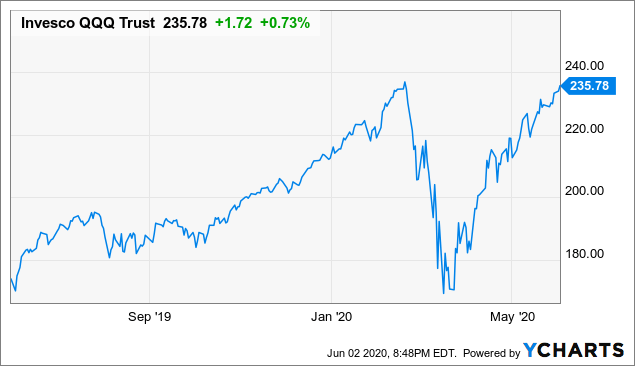
Data by YCharts
It is easy to understand the bearish argument for QQQ. Valuations are elevated at times when the economy is still in a recession and social unrest is reaching historical proportions. On the other hand, the bulls can argue that QQQ is home to high-quality stocks with solid fundamentals and pristine balance sheets. Besides, fiscal and monetary stimulus is producing a powerful tailwind for asset prices.
With QQQ facing such a strong set of cross-currents, trying to forecast the direction of the growth-oriented ETF is arguably harder than ever. Fortunately, you don't need to forecast the direction of the market to make smart investment decisions. On the contrary, measuring the main trend in prices and adjusting risk exposure accordingly can be a far sounder and smarter approach.
Zen And The Art Of Investing
Leonardo da Vinci is credited with saying that simplicity is the ultimate sophistication. Instead of trying to forecast the future direction of prices, it can make much more sense to assess the price action and manage your positioning based on currently observable data. This is in fact the approach followed by many of the most successful investors who ever lived.
In the words of Martin Zweig:
Big money is made in the stock market by being on the right side of the major moves. The idea is to get in harmony with the market. It's suicidal to fight trends. They have a higher probability of continuing than not.
In order to measure the trend in prices, we can use a simple indicator such as the moving average. The chart below shows the performance of QQQ in blue and its 50 days moving average in orange.
There are some false signals, of course, but the moving average does a good job of signaling the direction of the trend most of the time. A simple and straightforward approach would be staying invested in QQQ when the price is above the moving average and protecting your capital when prices are below the moving average.
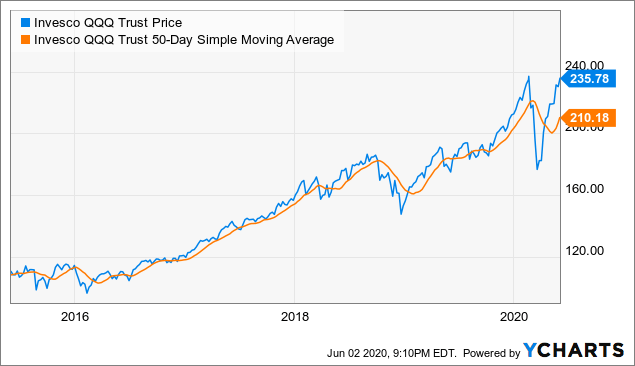
Data by YCharts
You can't expect the moving average to provide the right signals every time, no indicator can do that. However, there is abundant statistical evidence showing that trend-following strategies based on moving averages can be quite effective at optimizing returns and protecting your portfolio from severe drawdowns over the long term.
A research paper from AQR entitled A Century of Evidence on Trend-Following Investing examines trend-following strategies over more than a century of data and across different asset classes in different countries. The conclusions from the study are quite clear:
In this article, the authors study the performance of trend-following investing across global markets since 1880, extending the existing evidence by more than 100 years using a novel data set. They find that in each decade since 1880, time series momentum has delivered positive average returns with low correlations to traditional asset classes. Further, time-series momentum has performed well in 8 out of 10 of the largest crisis periods over the century, defined as the largest drawdowns for a 60/40 stock/bond portfolio. Lastly, time series momentum has performed well across different macro environments, including recessions and booms, war and peacetime, high and low-interest rate regimes, and high- and low-inflation periods
These findings show that trend-following has produced superior risk-adjusted returns in different periods and market environments, and across all kinds of instruments and regions. If the statistical data is any valid guide for the future, we have to acknowledge that trend-following strategies are backed by solid evidence.
Applying A Trend Following Strategy On QQQ
The triple trend strategy for QQQ is a quantitative strategy based on three different moving averages: 25, 50, and 100 days. We can imagine 3 different portfolios, each of them following a different moving average. When the trend is up the portfolio is allocated to QQQ, and when the trend is down the portfolio is allocated to the iShares 20+ Year Treasury Bond ETF (Nasdaq:TLT) for safety and capital protection.
We build a combined portfolio that is allocated 50% to the 50-day moving average portfolio, 25% to the 25-day moving average portfolio, and 25% to the 100-day moving average portfolio.
In simple terms, when QQQ is above the 50-day moving average, 50% of the total portfolio is allocated to QQQ. Then we allocate an additional 25% based on the 25-day moving average and the remaining 25% based on the 100-day moving average. The share of the portfolio that is not allocated to QQQ is always invested in TLT.
The reason for using 3 different moving averages is that there is always an important trade-off involved in selecting the period of the moving average to use. A short-term moving average provides faster signals, which can improve performance when the signals are real and long-lasting. On the other hand, a longer-term moving average is more robust, and it provides fewer false signals. By using 3 different time frames we are diversifying the risk regarding the unavoidable trade-off between speed and robustness.
Backtested Returns
The backtest calculates the total return of the combined portfolio since January of 2003. The strategy is rebalanced monthly, so you just need to check the position of QQQ versus the different moving averages and make the allocation decisions at the end of the month. The benchmark is a global 60/40 portfolio.
The triple trend strategy in QQQ produced a cumulative return of 548.8% versus 239.2% for the benchmark. In annual terms, the strategy made 11.4% per year versus 7.3% per year for the benchmark.
More importantly, the maximum drawdown - meaning maximum capital loss from the peak - was -19.2% for the triple trend strategy versus 35.4% for the benchmark.
(Click on image to enlarge)
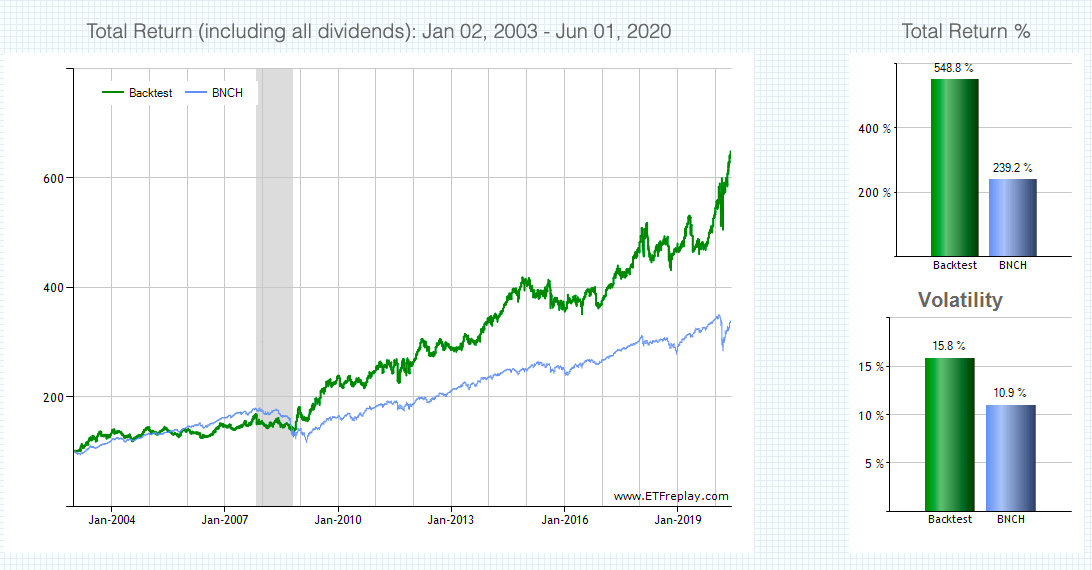
Source: ETFreplay
Source: ETFreplay
Looking at the historical performance for the triple trend strategy in different calendar years, it is easy to see that the strategy tends to produce solid returns in years in which the trend is strong, either up or down, for QQQ.
In years such as 2003, 2009, and 2017, when QQQ delivered big gains, the strategy captured a large share of those gains for investors. Alternatively, in periods such as 2008, when QQQ collapsed and TLT surged, the strategy was also well-positioned to benefit from the flight to safety among investors in TLT.
On the other hand, 2015 was the strategy's worst year so far, and this is because 2015 was a year with plenty of sideways moves and undefined trends in prices. In this kind of environment, the strategy will produce lots of false signals and returns will be ultimately disappointing.
The strategy is essentially based on trend-following principles, so it can be expected to perform well when trends are strong and to deliver subpar returns in periods when trends are weak and short-lived.
(Click on image to enlarge)
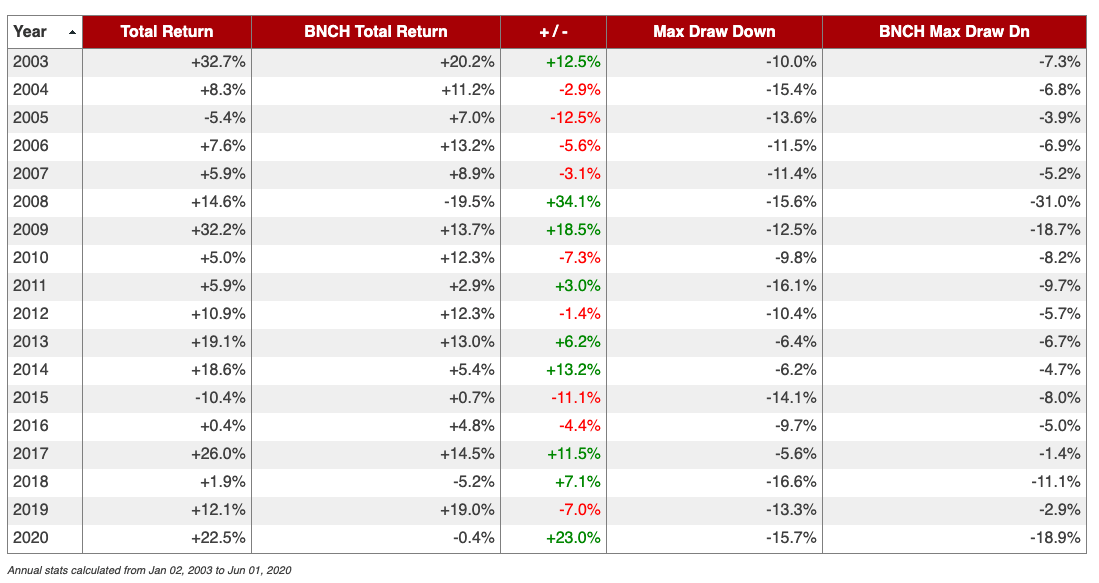
Source: ETFreplay
Reading The Signals In QQQ
The strategy has performed remarkably well in 2020 so far, with a cumulative return of 22.5% versus a decline of -0.4% for the benchmark. This is because at the end of February QQQ crossed below the 3 moving averages, so the portfolio was entirely positioned in TLT when stocks crashed in March.
After that, the 25 days moving average provided a bullish signal in early April, and both the 50 days moving average and the 100 days moving average turned bullish a few weeks later. As of the time of this writing, the signals are clearly bullish, with QQQ trading above the 3 trend indicators.
(Click on image to enlarge)
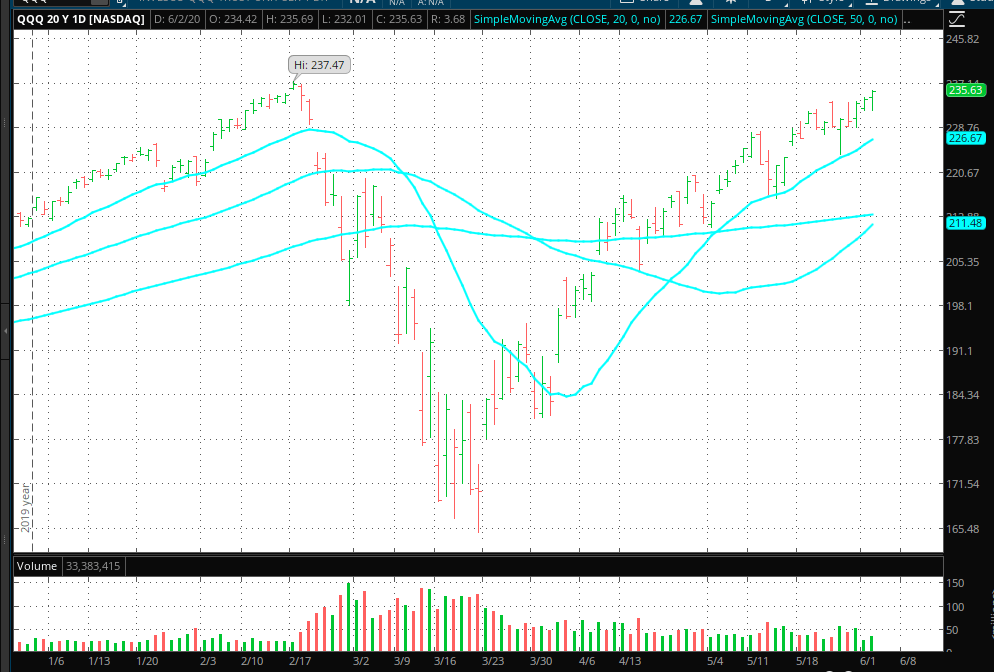
Source: TOS
We could highlight all kinds of arguments about why this could change in the future, and it is always important to remain flexible and open to all possibilities. But it is what it is right now, and QQQ is in a bullish trend across different time frames.
Disclosure: I/we have no positions in any stocks mentioned, and no plans to initiate any positions within the next 72 hours.
Disclaimer: I wrote this article myself, and it expresses my ...
more

