
ILF: This Overlooked International ETF Has 20% To 33% Potential Upside
There's a whole world of stocks out there, beyond the U.S. stock market.
Virtually every year, multiple international markets dramatically beat the S&P 500 Index. But many international stocks aren't even listed for trading on U.S. stock exchanges.
The nice thing for active investors and traders these days is that you can have access to almost every international stock market in your normal (or retirement) brokerage account (including trading options on them), through using exchange-traded funds (ETFs).
I looked at the universe of international ETFs, using a screen that finds those that are liquid (over 500k average daily volume and with options trading available) and showing price action strength (currently above their 20-, 50- and 200-day moving averages).
And while the SPYders are off to a strong start in 2017, there are over 30 qualifying international ETFs that are beating the market this year. They primarily come from the Asia and Latin/South America regions.
For further 2017 gains and broad market outperformance, my favorite selection among these is iShares Latin America 40 ETF (ILF).
ILF seeks to track the performance of 40 of the largest Latin American equities; it actually holds around 42 stocks currently. The top 10 holdings of this ETF comprise around 50% of the total assets.
While ILF holds equities from Brazil (EWZ), Mexico (EWW), Chile (ECH), Peru (EPU) and Colombia (GXG), the dominant holdings are in stocks from Brazil (60% of assets), Mexico (24%) and Chile (10%).
The top two holdings of this ETF are in Brazilian bank stocks, ITAU Unibanco (ITUB) and Banco Bradesco (BBD), but it also has significant holdings in the Materials, Consumer Staples and Energy sectors.
You might be thinking, "Why would I want to own Brazil and Mexico stocks? Those are areas that I keep reading are having economic and political problems."
Well, as the old saying goes, "The tape tells all." This means the price action is the most important thing to know, and often takes into account forward-looking anticipated events and expectations, not just current ones.
And the price action in this group is very strong, which is the thing I'm most concerned with for my ETF trading. ILF is up over 11% year-to-date (YTD), while the SPYders are up 3% -- that is nearly 4x the gains. The bottom line is that big money is flowing into Latin/South American stocks, and this doesn't look likely to let up, in my view.
Even though it achieved strong gains in 2016, ILF can achieve further potential gains of 20% to 35%+ this year, in my analysis. This ETF is down so heavily from highs reached in 2011 and 2014 that there is plenty of upside recovery room in this rebound rally.
Take a look at the long-term ILF Weekly chart below.
This chart is similar to those that I utilize for trading sectors (with ETFs and ETF options) in our Wyatt Research ETF Sector Alerts premium service, which has unique, tested indicators and settings.
It includes Exponential Moving Averages (Exp MA), which show the average level over a certain time frame with a heavier weighting to recent price action (these are useful to show directional trends and support/resistance levels), and Williams Percent R, which is one of the oscillators I use to measure the strength of price action.
ILF Weekly Chart
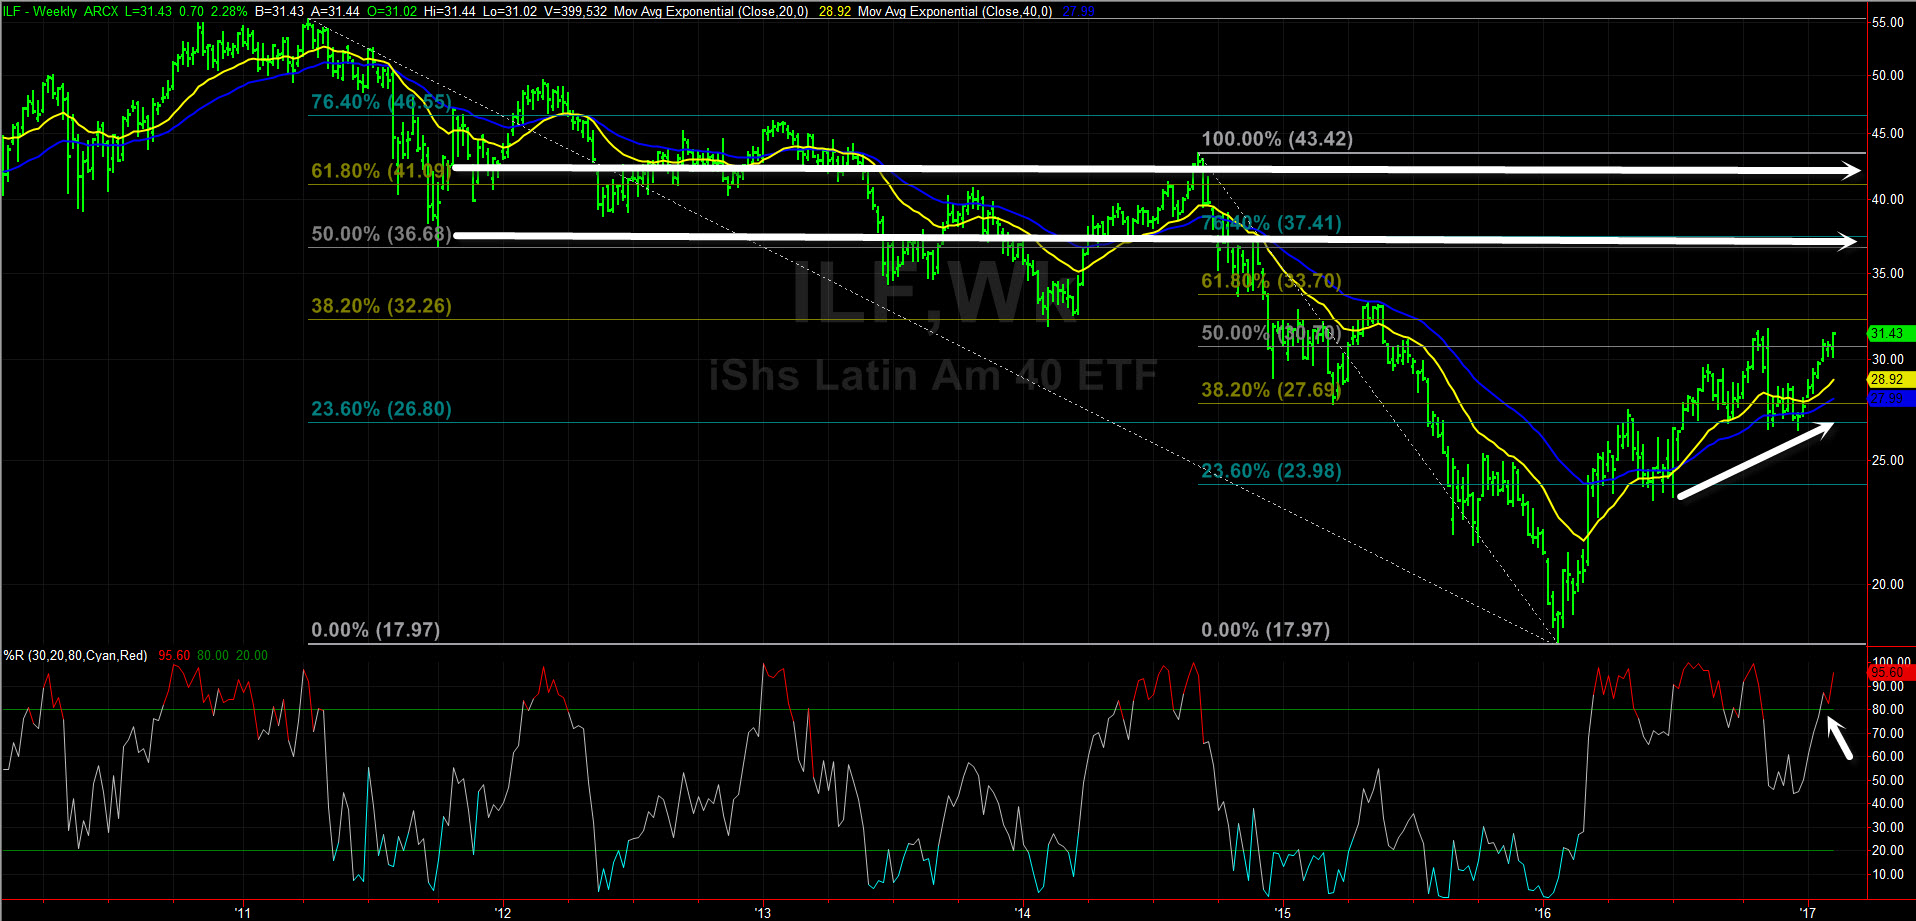
The more unusual indicator on this chart is Fibonacci Retracements. If you're not familiar with Fibonacci, it is based on a mathematical formula from the 1200s. Fibonacci sequences are found in nature and space, among other places, and derivations of it are used in science and finance.
I find Fibonacci Retracements very useful for determining key levels and targets for when a security is staging a rebound rally after downtrend. The 50% retracement is a common one you may be familiar with (it occurs often), whether you utilize Fibonacci or not -- the other retracement levels are 23.6%, 38.2%, 61.8%, 76.4% and 100%.
I placed the retracement on the key high to the key low; in this case, there was a key high in ILF reached in 2011 and more recently in 2014. The key low was pretty clearly reached in January 2016. The ETF has been rebounding since then, and shows strength in the uptrending Exponential Moving Averages (bullish crossover in 2016 and acting as support on pullbacks) and Percent R (breaking above the 80 bullish threshold recently).
The Fibonacci Retracement gives big-picture, long-term upside targets for ILF on this rebound rally.
In particular, note that 36.68 is a key level on the 2011 high and 37.41 is one from the 2014 high. I'll use 37 as a round number between these, giving a 20%+ potential gain from current levels.
Above that, 41.09 is a key Fibonacci level from the 2011 high and 43.42 is the high reached in 2014. Splitting the difference, 42 is a good round upside target in my view. Reaching that is around a 33% gain from current prices.
If you are long ILF, I would likely use a breach of the 29 or 27 levels as stop-loss triggers to exit the position.
Disclosure: None.


