
How To Protect Your Portfolio By Following The Signals From The Consumer Sectors
The U.S. stock market has just gone through the worst quarter in history, and investors are eager to know what this could mean for the markets going forward. Unfortunately, nobody can consistently predict the market, and trying to make those kinds of predictions generally produces more harm than good.
On the other hand, some quantitative indicators can provide valuable information to evaluate risk appetite and to make investment decisions accordingly. By reading the price signals from consumer discretionary and consumer staples stocks, we can gain key insights to manage portfolio risk in different environments.
A Tale Of Two Consumer Sectors
Consumer discretionary products and services are considered non-essential, but desirable when consumers have enough money to buy them. Typical examples include entertainment, restaurants, jewelry, fashion, and home improvement products.
For illustrative purposes, the table shows the top 10 holdings in Invesco S&P 500 Equal Weight Consumer Discretionary ETF (RCD), and it's easy to see what kinds of companies the sector represents.
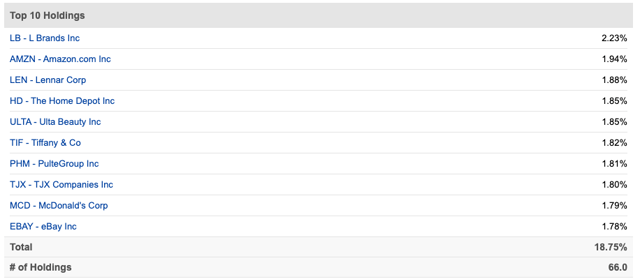
Source: Seeking Alpha
Alternatively, the consumer staples sector is focused on essential items such as food, beverages, tobacco, and household products. Most people are unable or unwilling to reduce spending on these kinds of items, even when under the most challenging economic conditions. Invesco S&P 500 Equal Weight Consumer Staples ETF (RHS) offers a portfolio of companies involved in areas related mostly to basic needs.
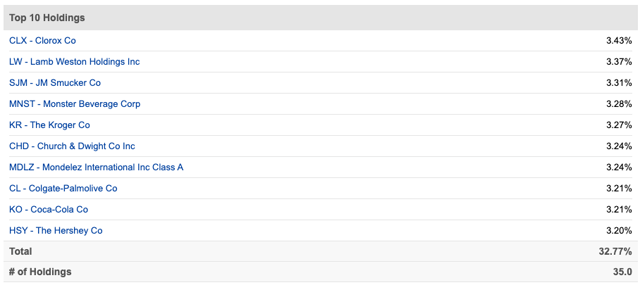
Source: Seeking Alpha
Not only that, but many of the companies in RHS also pay solid and recurrent dividends, and investors tend to gravitate towards safety and income in times of uncertainty. Since interest rates tend to decline in periods of slowing economic growth, the dividend payments from consumer staples stocks tend to become more attractive in comparison to fixed-income investments.
When risk appetite is rising and investors expect the economy to remain strong, chances are that the consumer discretionary sector will deliver bigger gains than the consumer staples sector, since consumer spending will be allocated to enjoyable products and services as opposed to bare necessities.
On the other hand, when investors are getting pessimistic and risk appetite is declining in the stock market, capital tends to seek refuge from uncertainty by investing in a more stable and reliable consumer staples sector.
Analyzing The Market Environment Through The Consumer Sector
In order to measure the relative performance of RCD versus RHS, we can build a relative return ratio, between the two sector-tracking ETFs. The ratio is the yellow line in the chart below, and the 100-day moving average in such a ratio is the black line.
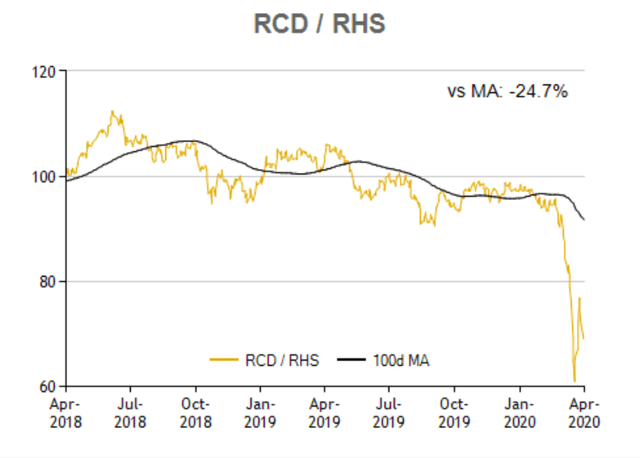
Source: ETFReplay.
When this ratio is rising, it means that consumer discretionary stocks are outperforming consumer staples stocks, so risk appetite is increasing among market participants. Conversely, when the ratio is declining, this means that money is flowing away from risky stocks and towards safer alternatives in the consumer space.
When the relative ratio is above the 100-day moving average, meaning that risk appetite is rising, the strategy is invested in SPDR S&P 500 (SPY). Conversely, when the ratio is below the 100-day moving average, the strategy buys iShares 20+ Year Treasury Bond ETF (TLT) for portfolio protection.
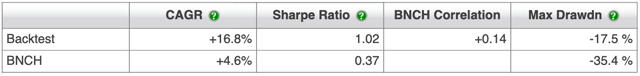
The chart shows the backtested performance statistics for the quantitative strategy versus a 60% global stocks / 40% bonds benchmark. Not only has the strategy produced superior returns, but also much smaller drawdowns over time.
The backtesting starts in May of 2007, because that is the first full month in which all of the ETFs are available for trading. Since then, the quantitative strategy has gained 633% versus 78.7% for the benchmark in the same period. The annual return is 16.8% for the strategy versus 4.6% for the benchmark.
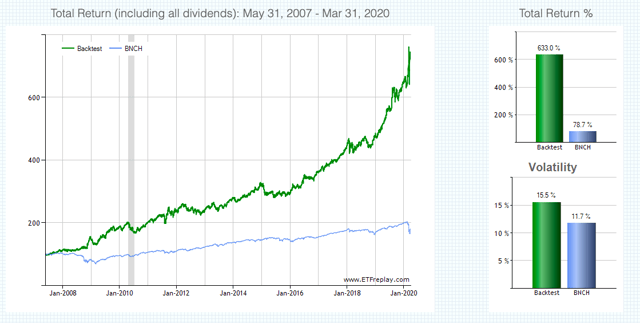
Source: ETFreplay
Such as important, the quantitative strategy has a maximum drawdown - maximum capital loss - of 17.5% versus a much larger drawdown of 35.4% for buy and hold investors in the benchmark.
In other words, the strategy is not only effective in terms of increasing returns, but the main benefit is that it does a great job in terms of risk reduction.
Source: ETFreplay
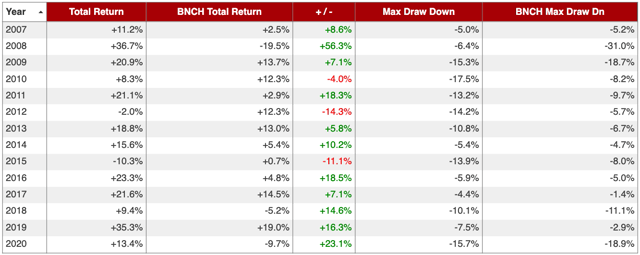
Providing more details, the table shows the annual returns and drawdowns for the quantitative strategy versus the benchmark in different years. The strategy outperformed by a wide margin during the Great Financial Crisis in 2008 and 2009 because it was positioned in treasuries during most of that period.
Most recently, the strategy was positioned in treasuries since January of 2020, so it avoided the COVID-19 selloff and it even made a nice return of 13.4% in the first quarter of 2020.
Source: ETFreplay
There are some important considerations to keep in mind when analyzing performance. This particular strategy was already positioned for safety in January, well before the COVID-19 crisis triggered a staggering selloff. However, there is no guarantee that the strategy will react with enough speed going forward, there is always some randomness involved when analyzing short-term performance.
The strategy only trades once per month, so there is always the possibility that the portfolio will be wrongly positioned and it won't be able to react with enough speed if the market decline happens in a short period of time.
Besides, market conditions have a big impact on performance. The strategy can be expected to deliver attractive gains in periods when there are strong and well-defined trends in the market, either up or down. Conversely, in a sideways year such as 2015, the strategy will probably deliver too many false signals and ultimately disappointing returns.
This strategy was originally designed with the traditional market cap-weighted versions of the consumer discretionary and consumer staples ETFs. Since Amazon (AMZN) now accounts for 26% of the Consumer Discretionary Select Sector SPDR ETF (XLY), the strategy then switched to the equal-weighted ETFs in order to guarantee that there is no one single stock having a big impact on the signals.
An equal-weighted approach is more representative, but it also can have some drawbacks. If Amazon continues stealing market share away from brick-and-mortar retailers, the losses from those retailers are actually Amazon's gains. However, since the ETF gives an equal-weight to all of the stocks in the portfolio, regardless of size, this can actually underestimate the true gains in the consumer discretionary sector as a whole.
When building these quantitative strategies you always need to make these kinds of trade-offs to some degree. All things considered, an equal-weighted approach is arguably superior to market-cap-weighted in this case, but there are also some solid arguments against equal-weighted ETFs.
The Bottom Line
These kinds of quantitative strategies have both their weaknesses and strengths. They tend to perform well in the long term, but they also produce false signals from time to time, especially when the markets are moving sideways. Importantly, when market trends are changing rapidly, there is always the risk that the strategy will not be able to react with enough speed.
But the idea is not making investment decisions based on one single indicator or strategy. We need to have multiple tools and indicators to evaluate market conditions, and then we make investment decisions by weighing the evidence from those indicators. A strategy such as this one should be seen as one piece of evidence in the big market puzzle.
The most serious mistakes that investors typically make are due to cognitive biases and emotions such as fear and greed. With this in mind, an investment approach supported by hard data and quantified evidence can be enormously valuable to make better decisions in the market.
Disclaimer: I wrote this article myself, and it expresses my own opinions. I am not receiving compensation for it. I have no business relationship with any company whose stock is mentioned in ...
more

