
How To Follow Price And Earnings To Protect Your Portfolio
Nobody can predict what the market will do next. However, we can pay close attention to some key variables in order to evaluate the market environment and manage portfolio risk accordingly. No prediction whatsoever involved in the process, it is all about data analysis and smart risk management.
This article is presenting a quantitative strategy that is focused on two main factors: price trends and earnings expectations. The strategy cannot be expected to make the right decision every time, but the data shows that this quantitative strategy can produce solid returns in terms of benefitting from strong bull markets and providing capital protection in a tough bear market.
Strategy Design
One of the most popular phrases in the market is "the trend is your friend". The concept may be a cliché, but this does not make it any less true. Humans - and the trading algorithms designed by humans - move in herds. Rising markets attract more buyers and falling prices attract more selling pressure.
The 200-day moving average in prices is a simple and effective trend indicator. The chart below shows the SPDR S&P 500 (SPY) ETF and its 200-day moving average. Most of the time, the moving average does a solid job in terms of signaling the main trend in prices over the long term.
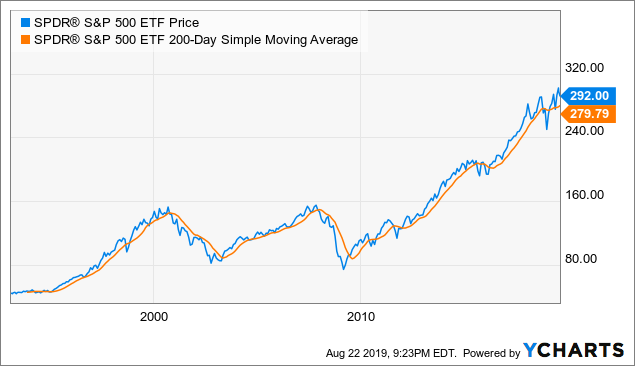
Data by YCharts
The quantitative system considers that the market-tracking ETF is in an uptrend when the slope in the 200-day moving average is positive in the past ten days. Alternatively, the market is considered to be in a downtrend when the slope of the 200-day moving average is declining over the past 10 days.
In addition to watching price trends, the strategy evaluates earnings expectations as a key fundamental indicator. In essence, a stock is simply a share in the ownership of a business, and the earnings produced by such a business have a big impact on the value of the stock. When earnings expectations are increasing, chances are that stock prices will also be rising and vice-versa.
Since earnings expectations can have too much volatility, the strategy smooths the data by comparing the 5-day moving average in earnings estimates for companies in the S&P 500 versus the 21-day moving average. When the 5-day moving average is above the 21-day moving average, this means that earnings expectations are increasing.
The quantitative strategy will be invested in the SPDR S&P 500 at all times, except when both market prices and earnings expectations are moving downward. The main idea behind this double-signal requirement is trying to avoid false signals as much as possible. This is mostly a long-term strategy that intends to stay in cash only when market conditions are particularly bearish.
Wrapping up when either prices or earnings - or both - are rising, the strategy will be invested in SPDR S&P 500. On the other hand, when both prices and earnings are declining, the strategy will be allocated to cash.
Backtested Performance
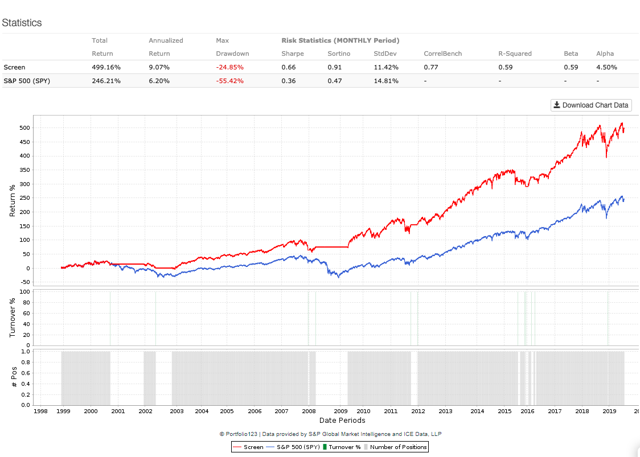
Since January of 1999, the quantitative strategy gained 499% versus 246% for buy and hold investors in SPDR S&P 500. Annual return amounts to 9.07% for the quantitative strategy versus 6.2% for a buy and hold position in the ETF. The strategy produces 4.5% in Alpha per year.
Perhaps more important, the main benefit of the quantitative strategy is a reduced market risk. The maximum drawdown, meaning the maximum decline in portfolio capital from the peak is 24.8% for the strategy versus a much larger drawdown of 55.4% for a buy and hold position in SPDR S&P 500.
(Click on image to enlarge)
Data from S&P Global via Portfolio123
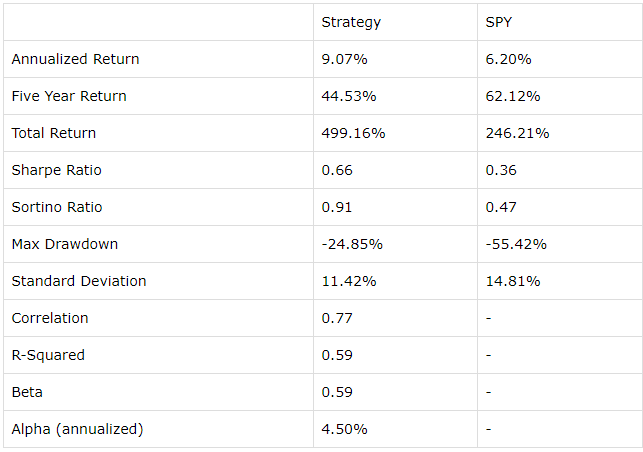
The table below offers more data regarding the quantitative strategy versus buy and hold. The strategy produces both higher returns and lower risk, so risk-adjusted performance is obviously superior over the long term.
On the other hand, the strategy has underperformed versus buy and hold in the past five years. The strategy went to cash for a few months in 2016 since that was ultimately a shallow market pullback as opposed to a deep bear market, this move had a negative impact on returns for the quantitative strategy.
The strategy outperforms in the long term by avoiding deep bear markets such as those in 2001 and 2008. Conversely, when markets are doing well and price pullbacks are small, portfolio protection has a negative impact on returns.
No strategy can outperform all the time and in all market conditions. If you want to protect your capital in a difficult market environment to avoid deep drawdowns, then you need to be willing to assume to the risk of selling too early during a relatively small market pullback.
(Click on image to enlarge)
Data from S&P Global via Portfolio123
Reading The Data
In terms of price trends, the 200-day moving average in is currently flattening, which is due to the fact that the SPDR S&P 500 has produced mediocre returns in the past 12 months. But the slope in the moving average is still positive and the market tracking ETF is still above such a moving average, so this signal is in risk-on mode.
(Click on image to enlarge)
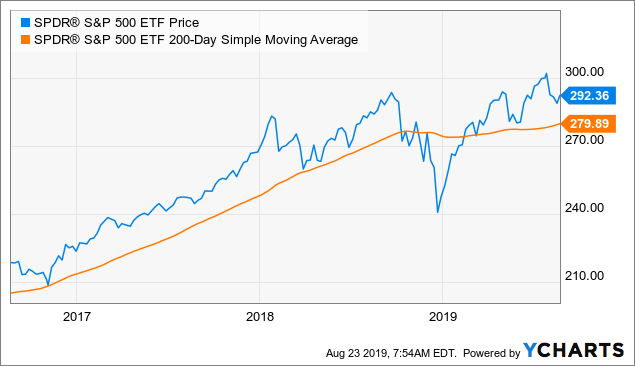
Data by YCharts
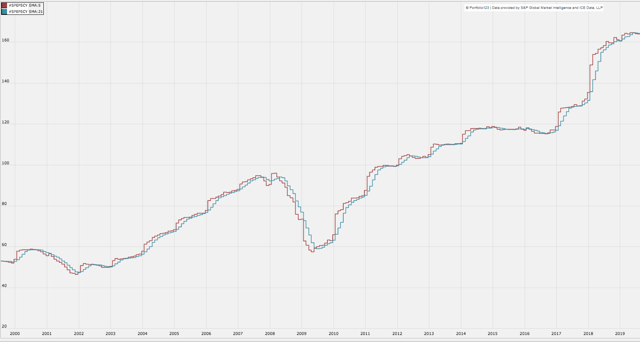
Earnings expectations are telling a more complicated story. The chart shows the 5-day moving average in earnings estimates for companies in the S&P 500 in red and the 21-day moving average in blue. When the red line is above the blue line, we can say that earnings expectations are increasing and vice-versa.
If you look at big recessions such as 2001 and 2008, earnings expectations were clearly declining. On the other hand, during periods such as 2015 and 2016, when the economy was slowing down but there was no recession, the trend in earnings expectations was mostly sideways. This is the situation right now, as the curve has been moving laterally as opposed to up or down in recent weeks.
This can be attributed to factors such as the tax cut last year making comparisons more challenging and the trade war generating concern among analysts. It will be important to watch how this data evolves going forward since further deterioration in the economic landscape could produce a breakdown in earnings expectations. As of today, however, the damage looks quite contained.
(Click on image to enlarge)
Data from S&P Global via Portfolio123
As of the time of this writing, the quantitative strategy remains in risk-on mode and invested in SPDR S&P 500. Price trends remain moderately bullish, and earnings expectations are quite close to a critical level. It will be particularly important to watch how the market environment evolves in the coming days.
Disclaimer: I wrote this article myself, and it expresses my own opinions. I am not receiving compensation for it. I have no business relationship with any company whose stock is mentioned in ...
more

