
How To Buy Top Stock & ETF Breakouts On A Pullback
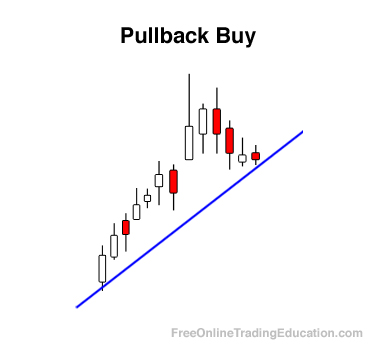
Pullback trading is a fantastic way to buy the best stock and ETF breakouts without chasing the price. Here’s a simple and effective way to profit from trading breakouts on a pullback.
The majority of swing trade stock picks in our 17-year old nightly newsletter, The Wagner Daily, are set up to buy before an obvious breakout above resistance.
However, even the most astute trader cannot possibly catch every great breakout before it happens.
As such, you need to maintain a pullback trading strategy in your arsenal to take advantage of short-term weakness in uptrending stocks with relative strength.
Overview: How It Works
We generally prefer to buy a breakout stock below the range high whenever a tight trading range develops near a key moving average, such as the 20-day EMA or 50-day MA.
Not all stocks that break out will produce a low-risk entry point on a pullback. But for those that do, the pullback setup helps identify a low-risk entry point and prevents chasing the price action higher.
Our pullback trading method for buying breakout stocks is based on William O’Neil’s famous CAN SLIM™ stock trading strategy. In a nutshell, here’s what we look for:
Identify a breakout from a valid basing pattern in a stock or ETF that has moved higher on increasing volume and is part of an industry group with relative strength to the broad market.
A “valid basing pattern” is explained here.
Increasing volume is the footprint of mutual funds, hedge funds, and other institutions accumulating the stock or ETF. As such, volume should surge higher than average to confirm each breakout. At a minimum, volume should swell noticeably higher than the average volume of the previous ten days.
Once a breakout setup is located, we then put the stock or ETF on our internal watchlist and monitor the price action for a two to three-day pullback.
How We Bought Semiconductor ETF (SMH) On A Pullback
On October 31, we began stalking VanEck Semiconductor ETF (SMH) for potential buy entry after it broke out the previous week, then gently pulled back for three days.
(Click on image to enlarge)
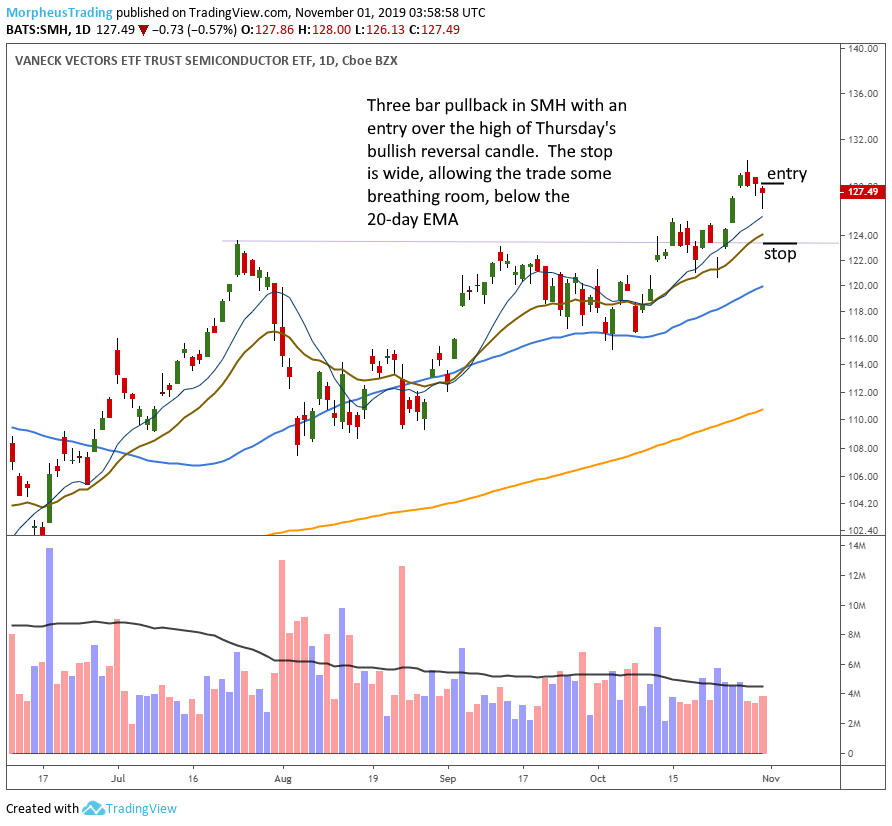
Here is our actual commentary that accompanied the chart above:
“We have one new official setup for Friday in the model portfolio. SMH closed with a bullish reversal candle on Thursday after an orderly three-day pull back off the recent high, which reversed just shy of the 10-day MA. Money has been flowing into semiconductor stocks the past two weeks. Grabbing some SMH on a pullback will give us some exposure while we wait for better setups to emerge.
We are placing a buy stop order above Thursday’s high. The protective stop is below the 20-day EMA just to give the trade some breathing room.”
After SMH broke out to a new high in late October, lower volume accompanied the pullback for the first two days off the high–check!
Volume increased on the third pullback day, but the stock formed a bullish reversal candlestick by closing near its intraday high (which is fine).
Although we set our initial stop below the $124 level, it also would have been fine to set a stop for half the position below the low of the reversal candlestick, with a stop below the 20-day EMA for the rest. There is no right or wrong here–it’s just a matter of preference.
SMH immediately followed through and zoomed higher after triggering our buy entry, which is nearly always a great sign:
(Click on image to enlarge)
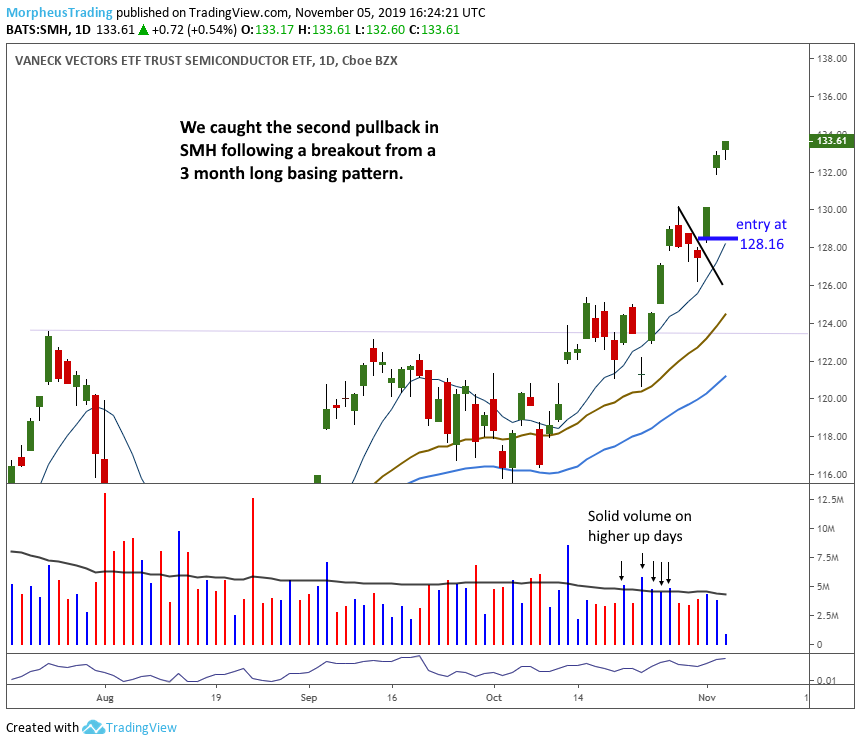
As of the November 5 close, our SMH swing trade is already showing an unrealized gain of roughly +4% just two days after our entry.
Top 4 Tips For Profitable Pullback Trading
1. The pullback should generally consist of two to three days of “lower highs” and “lower lows.” Two lower highs and lower lows along with an inside day is fine as well. An inside day occurs when a bar’s price range is completely contained within the prior day’s trading range.
2. The pullback should be marked by orderly price action and decreasing volume. “Orderly price action” means the intraday trading range of each day should be about the same. However, reversal candlesticks can be a bit more volatile.
3. Avoid pullbacks with several days of volatile price action and/or pullbacks with significant opening gap downs. Unlike #2 above, such this is often negative and can indicate the balance of power is shifting to the bears (price exhaustion).
4. Avoid pullback setups where volume during the pullback is higher than volume during the preceding rally. Just as higher volume on a breakout indicates institutional accumulation, lower volume on the pullback means the bears are NOT quickly stepping in to sell when the bulls are taking a rest–the hallmark of relative strength trading! Remember that volume doesn’t lie and is one of the most reliable technical indicators at your disposal!
Disclaimer: Past results are not necessarily indicative of future results. There is a high degree of risk for substantial losses in trading securities. All data and material on this website and/or ...
more

