
Happy New Decade And New Market Calendar Range

Welcome to the new year and the new decade!
As we look ahead into January, the 6-month calendar range could be even more influential than usual.
After the first 10-trading days in January, a range is established.
That range becomes a guideline for the next 6 months until it resets in July.
Should an instrument clear the top of the range by the end of the 10-days, the statistical chance of follow-through to the upside is more significant.
Conversely, should an instrument break the bottom of the range by the end of the 10-days, the statistical chance of follow-through to the downside is more significant.
Should the instrument remain within the trading range, then one would expect more chop until the range resolves one way or another.
We at MarketGauge, are particularly focused on this upcoming calendar range because of the new decade.
I will have a lot more information in the upcoming Daily’s about the seasonality of new decades and particularly the percentages of loss versus gains on years that end in a zero, such as 2020 does.
I will also report on the Economic Modern Family as well as the Chinese astrological impact of the upcoming Year of the Rat.
Perhaps the most interesting reason this year’s January 6-month calendar range should resonate more is because it corresponds with the January 15th target date for the signing of the Phase One China deal.
(Click on image to enlarge)
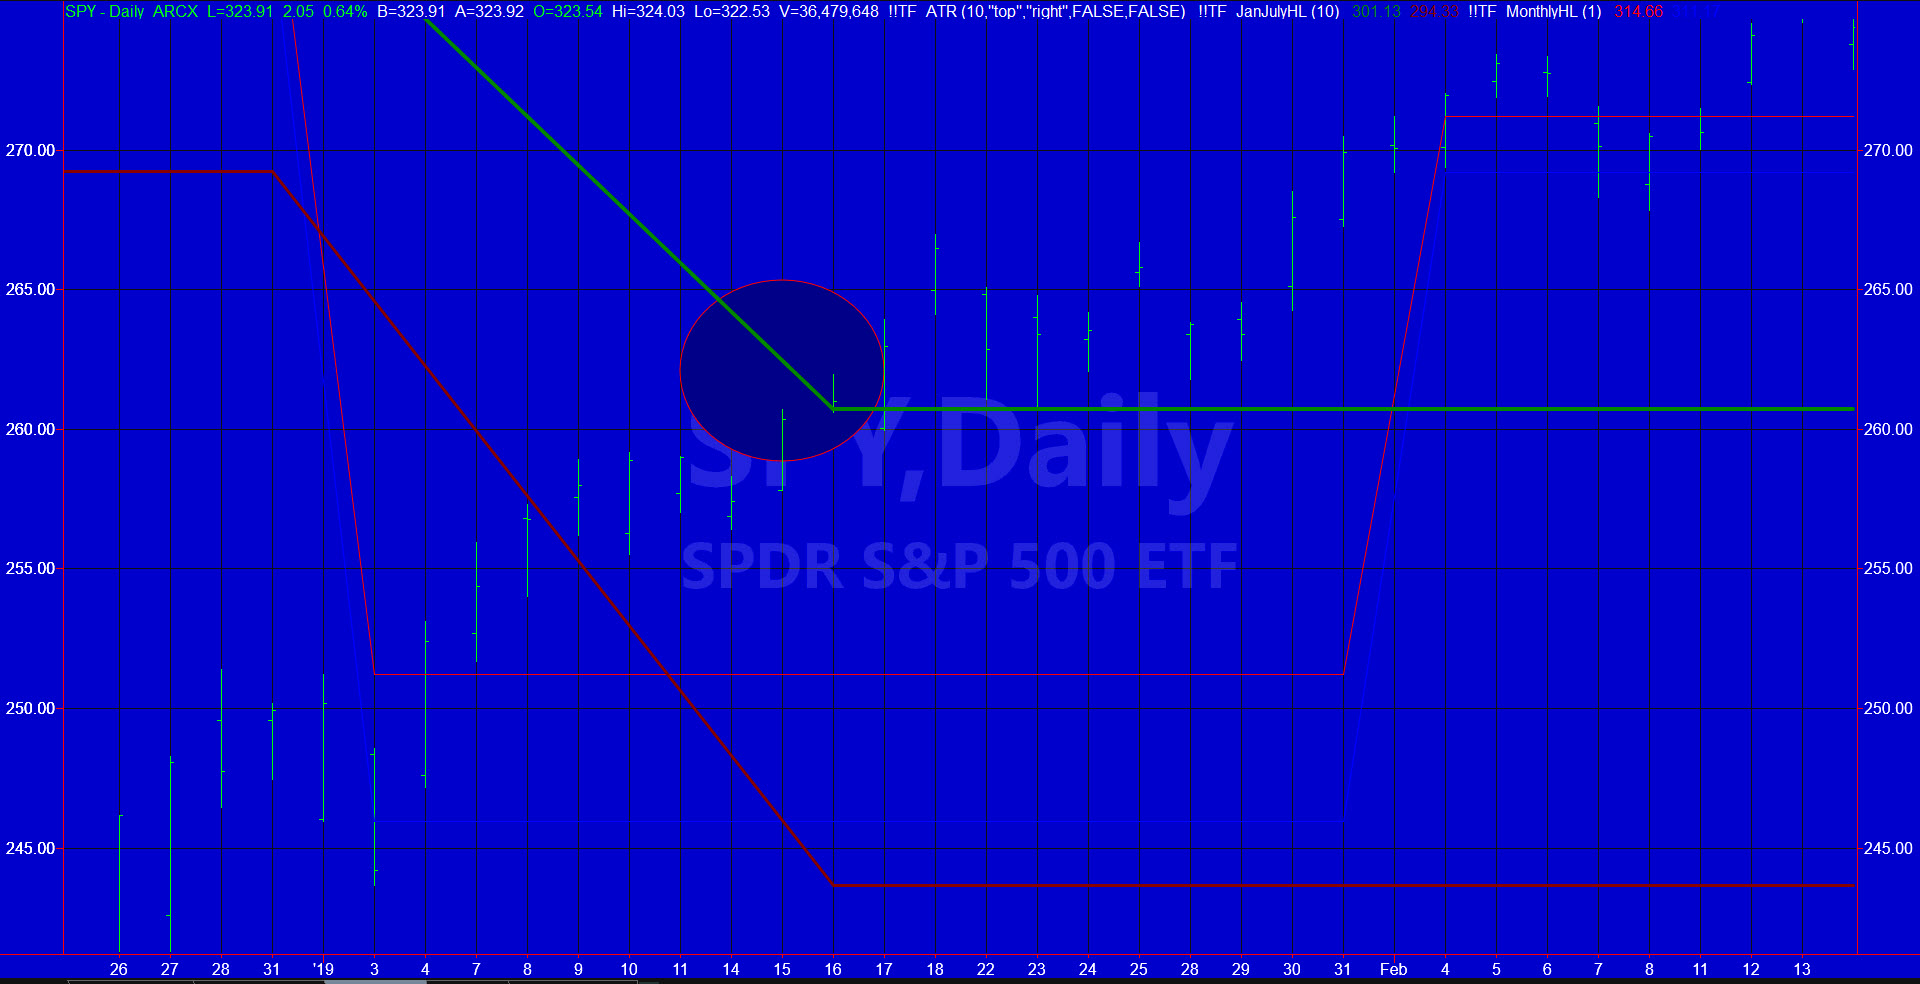
In 2019, SPY broke out from its calendar range on the 11th trading day.
Now remember, this was after a nearly 20% correction the market had at the end of 2018.
The chart shows the calendar range high in green. The price of SPY at the time was just over $260.
By July, when the calendar range reset, SPY traded at $300.
The summer correction was clear on the calendar range chart.
SPY broke down under the low (red line) and sold off by over $20.00.
Not until this past October 2019, did the range clear back over the green line, which until it resets on January 15th, gave the bulls another reason to believe we could see the move to $324.89 we saw today.
(Click on image to enlarge)
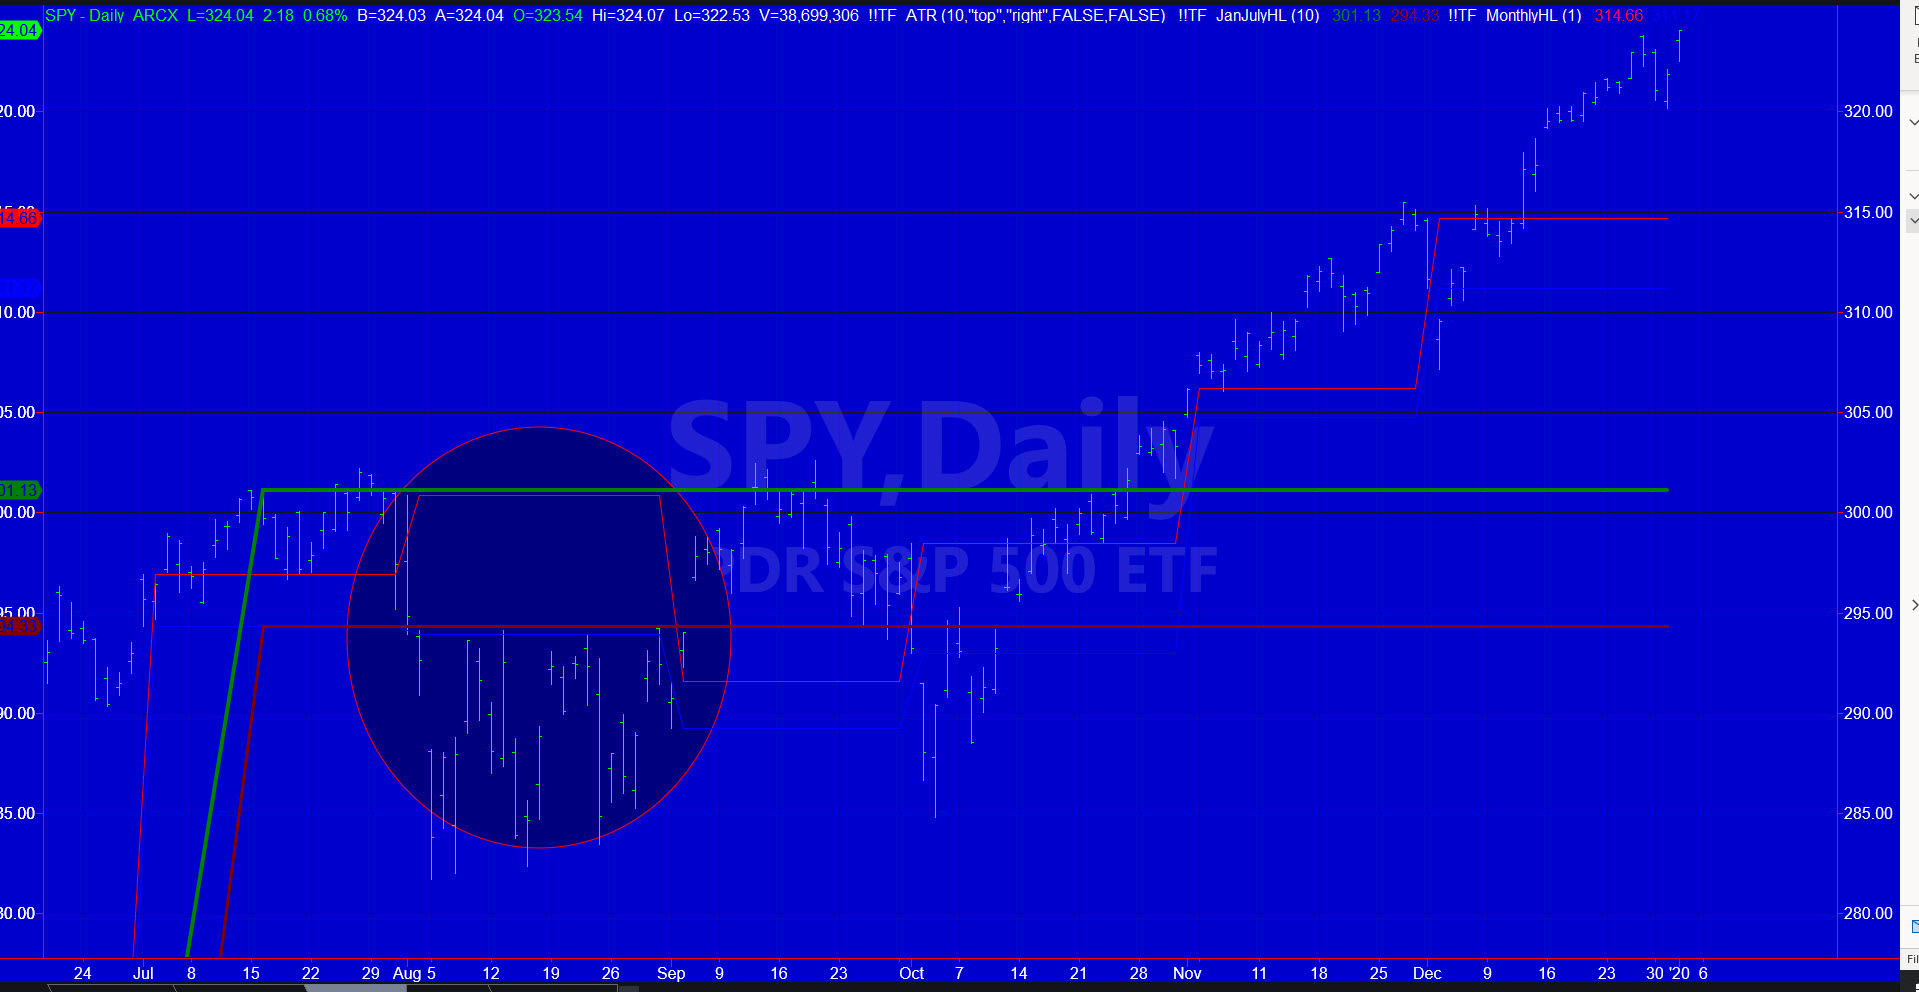
Of course, there are other factors to watch along with the calendar ranges.
And every instrument will create a range.
The takeaway here though is that the January 15th date is an interesting coincidence to the Phase One date.
Therefore, I am not too worried about following the existing bull trend.
Nevertheless, I will keep big eyes on what happens once the 6-month range is established.
At that point, you will have another reliable indicator to follow, which should help you eliminate the noise of the talking heads.
S&P 500 (SPY) Another new all-time high. 321.75 support and then 320 key.
Russell 2000 (IWM) Must clear 167.12 with 166 pivotal and 164.23 support
Dow (DIA) New all-time high 288.63 with 285.50 support
Nasdaq (QQQ) New ATH at 216.16 with 212.50 support
KRE (Regional Banks) 57.52 support, 59.50 resistance
SMH (Semiconductors) New ATH at 144.94 with 142.40 key support
IYT (Transportation) 195 is still key pivotal area. 200 key resistance
IBB (Biotechnology) 121.50 resistance and 116 support
XRT (Retail) 45.41 pivotal. 46-47 resistance
MMMAPremium Service will be watching the market carefully, along with the comprehensive ...
more

