
Happy Holidays And This Is What Makes A Market

The State of the Market:
Stop me if you've heard this one before. Stocks have been rallying lately on word that Mitch McConnell's gang isn't planning on heading home for the holidays without a stimulus deal. Well, that and the fact that the FDA is about to approve a second COVID vaccine for emergency use. While both are clearly constituents of the good news category, investors can't be blamed for asking, how many times stocks can advance on the same headlines?
In terms of positive market drivers, our heroes in horns remind us that there are a couple of other things at work here worth noting. First, there is a little thing called "performance anxiety," which is a kissing cousin to FOMO (Fear Of Missing Out). There is positive seasonality - as in the traditional "Santa Claus" and "Year-End" rallies. There is the idea of money flows (managers don't want to be caught with too much cash on their books with the S&P up 16%). And one of the old standby's in the bull camp, TINA (There Is No Alternative) - thanks to rates remaining at/near generational lows.
But... With all that good stuff supporting them, the bulls haven't been able to make much headway on the blue-chip indices such as the Dow and S&P 500. Our furry friends in the bear camp opine that this is due to the ideas that (a) stocks are overbought, (b) sentiment is too positive, (c) valuations are in the stratosphere, and (d) the current rally is "pulling forward" gains from next year based on stuff that hasn't happened yet (aka, stocks are discounting positive expectations).
It is said that this is what makes a market. And with both teams having decent arguments, the S&P appears to be caught in another sideways pattern (see chart below). Which, of course, is better than the alternative to what tends to happen whenever stocks experience an eye-popping joyride to the upside. As one of my colleagues put it yesterday, "It looks like sideways is the new down."
The good news for anyone holding equities right now is the action in the league-leading small-caps is downright positive. Don't look now fans, but the once lagging small-caps put in a record-breaking month in November (as measured by the iShares Russell 2000 ETF - IWM), are now ahead of the S&P 500 YTD and are continuing to advance so far in December.
The point here is that when there is doubt about the direction in which a sideways move will be resolved, technicians tell us to "follow the leaders." So, with the small-caps clearly in the lead and movin' on up on the charts (see below), it makes sense (well, to me, anyway) to continue to give the bulls the benefit of any/all doubt.
To be sure, we can expect the bears to try and make some noise between now and New Year's Eve. However, based on the bull camp's PowerPoint deck, I think it makes sense to be ready to buy any dips that may occur in the next month or so.
The State of the Trend Indicators
Save a projected pullback by the Cycle Composite over the next week, the Trend Board remains in great shape. It is clear the Bulls remain in control of the ball.
(Click on image to enlarge)
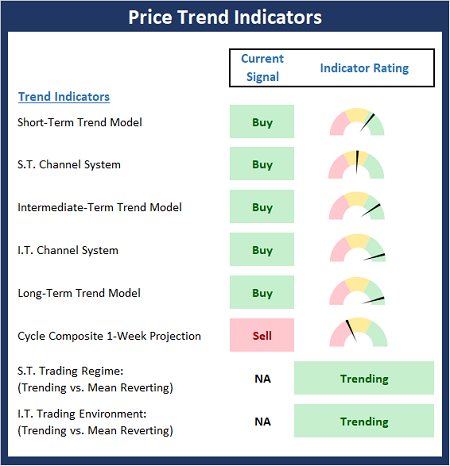
About The Trend Board Indicators: The models/indicators on the Trend Board are designed to determine the overall technical health of the current stock market trend in terms of the short- and intermediate-term time frames.
My Take on the State of the Charts...
While the S&P 500 looks to be caught in sideways trading range, the small-caps are still moving toward the upper right corner of the charts. Thus, we can argue that there is some rotation occurring, which isn't to be feared. Yes, the bears could certainly get something going for any reason. However, I think it makes sense to stay seated on the bull train for now.
S&P 500 - Daily
(Click on image to enlarge)

There can be no denying that the Russell 2000 ETF (IWM), which is considered a proxy for the action in the small-cap space, paints a very nice picture. We consider this a leadership move and likely to be a "tell" about the next move for the overall market from an intermediate-term standpoint.
Russell 2000 Small-cap ETF (IWM) - Daily
(Click on image to enlarge)

Next, let's check in on the state of the market's internal momentum indicators.
The Momentum board is also in very good shape and confirms the current bullish trend.
(Click on image to enlarge)
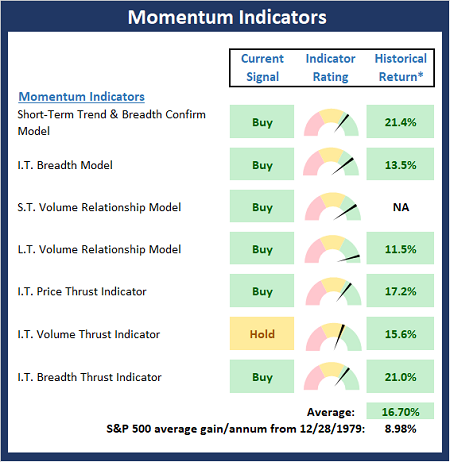
* Source: Ned Davis Research (NDR) as of the date of publication. Historical returns are hypothetical average annual performances calculated by NDR.
The opinions and forecasts expressed herein are those of Mr. David Moenning and may not actually come to pass. Mr. Moenning's opinions and viewpoints regarding the future of the markets should ...
more

