
Gold: Weekly Bullish Sentiment Targets The 1,465-1,450 Area As Major Buying Opportunity For 2019
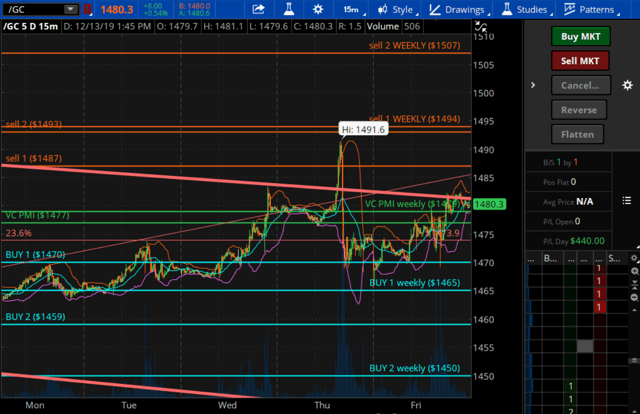
The average weekly price for gold is at $1,465. The Sell 1 level is at $1,478 on the weekly. The market went up today, Friday 13th, to a high of $1,477.50 and that satisfied the criteria to go short the market, which we recommended to our subscribers.
One of the things that we do is that we advise and keep our subscribers alert. We use a Live Trading Room and text messages to let subscribers know when a trigger is hit. This morning with the $1,477.50 trade, we already took out about $440 per contract. It seems that now the market, after touching the $1,477 average price on the day, has reverted back down and activated the Buy 1 level of $1,463 as the next target. The weekly average is $1,465.
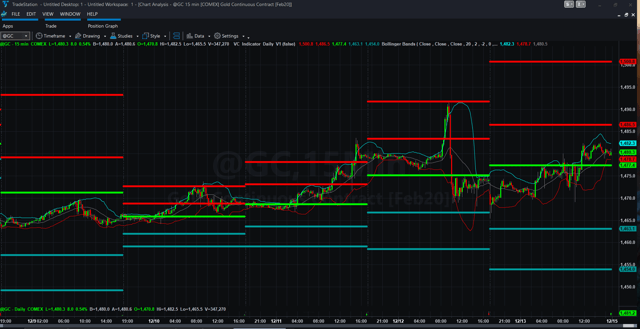
Courtesy: TradeStation Technologies
The VC PMI
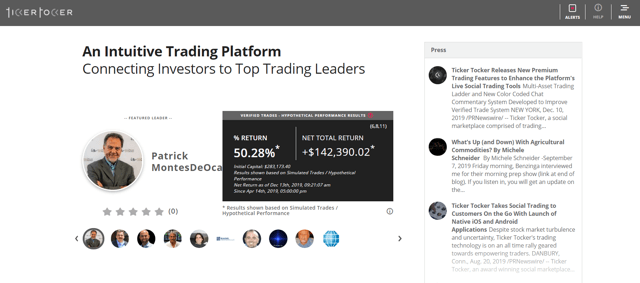
As self-directed traders using the Variable Changing Price Momentum Indicator (VC PMI), we basically use this information for us to execute trades in our account at Ticker Tocker, which also verifies every trade we make.
One thing that we do a little differently is that we use the VC PMI to trade Triple X high velocity ETFs, such as JNUG, NUGT and DUST. Our results are based on trading NUGT, DUST, and SILJ for the silver market. These are Triple X velocity ETFs that I would not recommend holding onto long term, but we use to take the risk out of a futures contract shortdust - term by not having margin on the trade. We are using the Variable Changing Price Momentum Indicator (VC PMI) on the gold market, but positioning my capital in cash value asset, such as NUGT or DUST.
We are long DUST, which is a Triple X velocity ETF that basically is a bear ETF. What this does is that the value of the ETF goes up as the price of gold goes down. I use this short-term whenever I see a short-term move in the market that I can take advantage of and use it as a hedge or speculative instrument. The volatility is fantastic. The low made today was at 6.63 and we are trading last at 7.17 - and that is one day's trading range. This is a way for us to manage the risk or transfer the risk of a margin for a futures contract into a cash-value asset. The velocity is based on the underlying instrument, either futures or stocks. In the case of USLV, another ETF, which is a double velocity ETF, it is based on the volatility of the futures contract.
For traders who have traded the futures contracts, they can understand that there is a big risk involved in margin calls. Unless you are well financed and well versed in money management, trading futures contracts can be challenging to say the least. We show our subscribers, who are interested in taking these incredible opportunities, how to take control over your destiny by making wise choices. These markets are one of the few left that are free markets, although the metals are highly manipulated by interest rates and the price of gold is also highly manipulated. But even though certain institutions try to manipulate the gold market, it still provides an excellent opportunity.
We use the VC PMI based on supply and demand to trade the market. The VC PMI identifies an average price for the day, week or month, as well as a perfect five-level Fibonacci structure. Beyond that average price, there are two extremes above the mean, Sell 1, which has a 90% probability that if the price is activated at that level, it will revert back to the mean. The mean is a 50/50 standard deviation, with an even chance that the market will go up or down. The Sell 2 level, if triggered, is a 95% probability that the market will revert back to the mean.
If we look at the chart yesterday, we have been using the weekly data since it only changes once a week. We have been on a bearish note on a weekly basis. Yesterday the market went up to 1,491.60, and the daily sell 1 was 1,491. It activated a daily short signal, and it reverted back to the average price.
Now the market appears to be entering a bearish trend momentum, activating the targets of $1,463 to $1,454. In order for us to manage the volatility from the mean, above or below, we use ETFs and stocks. The artificial intelligence tells you that at the mean, which indicates a 50/50 standard deviation, the market could go up or down. After many years in the markets, we recommend using the highest probability trades. You don't have to trade every single bar. Use a methodology instead of just trading at random or by the seat of your pants. Identify the sectors you want to trade and then come up with a structure to trade those markets. The supply and demand is crucial to understand for each market.
The VC PMI Signals For Next Week
"I created a structure (the VC PMI) that would give me basically two levels above and two levels below the mean," Equity Management Academy CEO Patrick MontesDeOca said. "We wrote the program in C++ in TradeStation and it's called the VC PMI."
The VC PMI provides mathematical probability factors. When a signal is triggered, the VC PMI tells us what to do. When the market is trading around the average price, it identifies the trend momentum of the market up or down for the day. If you don't have a position, then the first thing to do is to see what the price does or where it is in relation to the VC PMI's levels.
Right now, we are flat, waiting for the market to come back up to $1,487 and activate a new short trigger. The high on this day was $1,481.1, so we have been testing this resistance of Sell 1 on a weekly basis. We have also been testing the daily average price at $1,477. The fact that the market did not penetrate the weekly $1,488 level is bearish, so we are on a short trigger on the weekly. On the daily signal, the trend momentum has turned bullish next week and has activated the $1,487 weekly target. Very close to that target is $1,494, the weekly sell 1 level. Below the weekly mean of $1,479, you can see the synergy of the weekly price $1,465 to $1,450, where if the market comes down to that area, to cover your short position and go neutral. Look for reversion to unfold from these levels and activate a buy signal. Your stop on the weekly long trigger is a close below $1,450. The way you manage the account is based on your own financial position and strategy. We coach our subscribers one on one, based on their personal situation.
Let's see if we get the target of $1,465 on the short trade from $1,488. Our stop is $1,487 for next week.
Disclosure:I am long DUST.
To learn more about how the VC PMI works and receive weekly reports on the E-mini, gold and silver, check us out on more


