
General Stock Market Commentary - Friday,July 3
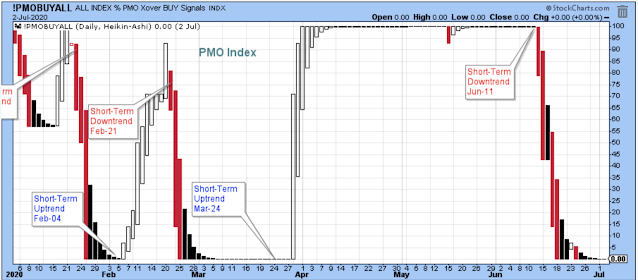
During the trading hours on Friday, I thought that a new short-term uptrend had started for the general market. However, after reviewing the charts, I think we are still waiting for the new trend to begin. For instance, there was no tick higher in the PMO index.
(Click on image to enlarge)
Some charts are starting to turn higher such as the SPX equal-weight. The stochastic is beginning to turn up off its lows while prices held above the uptrend line and the support level. This is a bullish looking set-up.
(Click on image to enlarge)

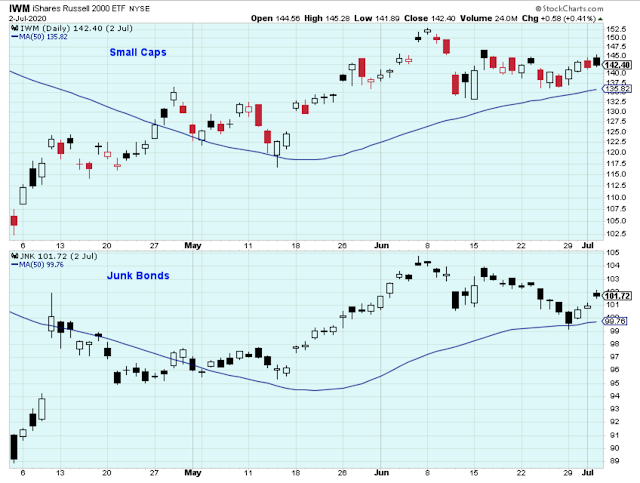
The canary indexes continue to trade above their 50-day averages. I like to trade in the direction of junk bonds so holding at the 50-day is encouraging.
(Click on image to enlarge)
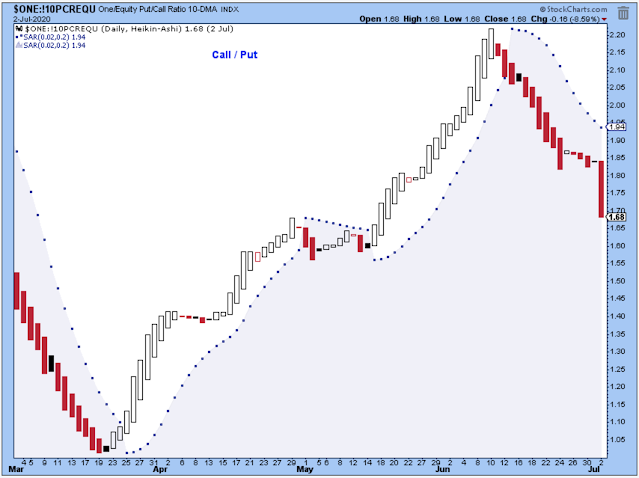
The 10-day call/put index (inverted put/call) was way off on Friday. My guess is that there was a lot of put buying in response to the spike in positive COVID cases. This is obviously the opposite of what we need to see in this index while looking for an uptrend.
(Click on image to enlarge)
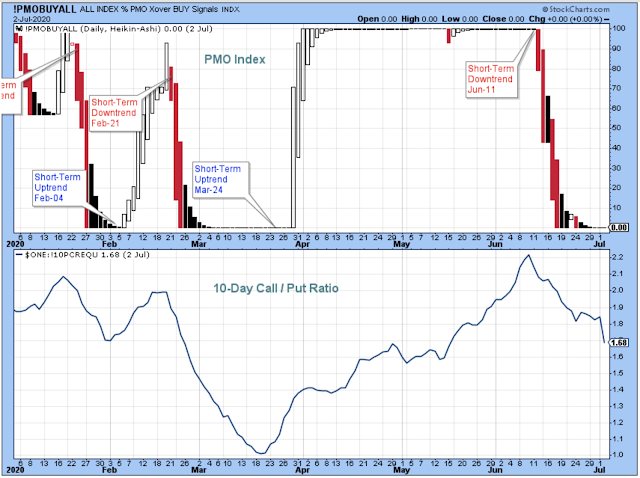
I added the 10-day call/put ratio to the lower panel of the PMO index chart, and you can see how nicely they correlate. So, in order to call a new uptrend, we need to see some evidence that the call/put is turning up while the PMO is at its lows.
(Click on image to enlarge)
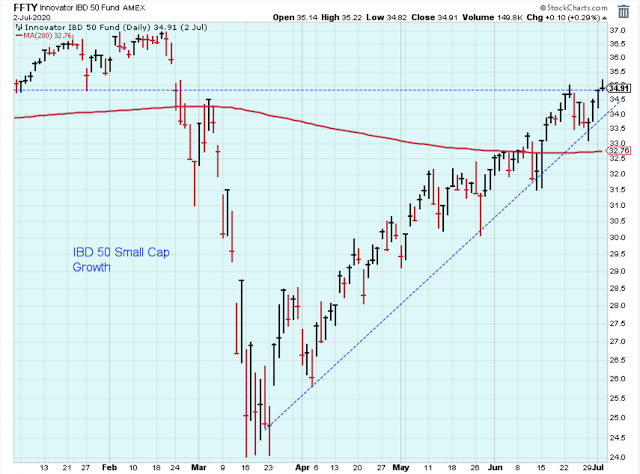
This is a chart of the FFTY ETF that holds some of the very best small-cap growth stocks, and it is a beautiful rally off the lows. Now it has reached up to its gap-down level in late-February.
What happens next? At a minimum, I think we should expect this index to at least struggle here a bit under resistance, and for a handle to form before heading higher.
(Click on image to enlarge)
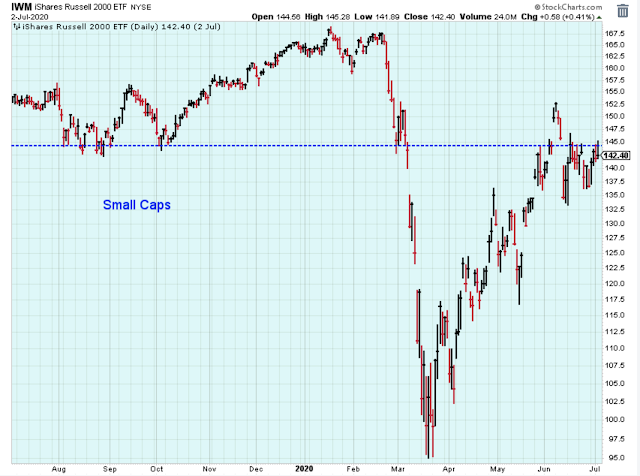
Another look at the small caps (IWM) just under resistance. A handle is already forming for this ETF. A rally above the 145-level would be positive for the general market.
I added this 1-year chart of the JNK ETF just to show how nicely the stochastic reveals the short-term turns in the trend. I think this is a reflection of the general stock market. We get 6-7 opportunities per year to buy stock market dips, and we are probably near one of those opportunities now.
Side note. There is always some sort of bad news near these lows, so you need to have a little faith and some risk-reward analysis to buy. In other words, you have to accept that at some point you are going to buy a dip that is actually the beginning of a bigger move lower. So, mark a line in the sand such as a sharp violation of the 50-day where you shift into reverse and accept some small losses in order to protect capital.
(Click on image to enlarge)

The Longer-Term Outlook
The ECRI index just keeps marching higher. There is a good chance that next Friday this index will rise above the negative-five-level where recession gives way to economic recovery.
(Click on image to enlarge)

The number of new highs has been gradually increasing while new lows barely exist. As a result, this index is beginning to come back to life.
(Click on image to enlarge)

I'm not sure how helpful this bulls/bears survey has been lately. At the moment, the survey has too many bulls, but this survey works better as a timing tool during a well-establish bull market.

Outlook Summary

The medium-term trend is down as of Feb-26
The short-term trend is down as of Jun-11
The economy is in recession as of Mar-28
Contrarian Sentiment favors not sure as of Jun-06.
The medium-term trend for Treasury bonds is up as of Jan-25 (prices higher, yields lower)
Disclaimer: I am not a registered investment adviser. My comments above reflect my view of the market, and what I am doing with my accounts. The analysis is not a recommendation to buy, ...
more

