
Four Thousand Twenty Reasons To Ignore Permabears
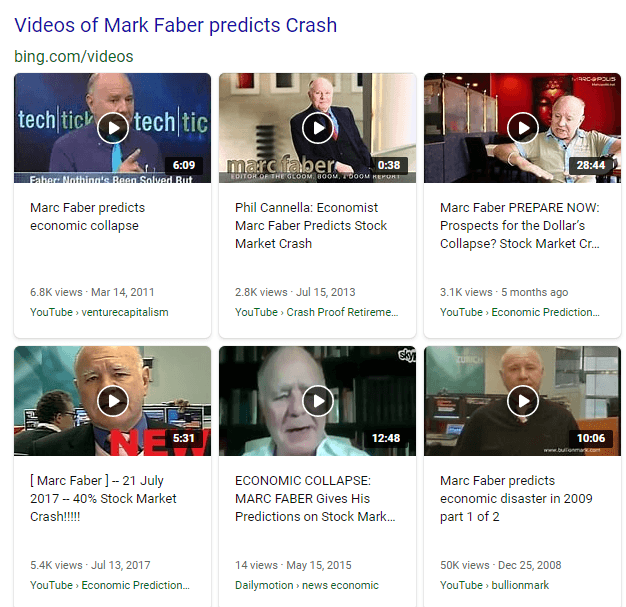
Marc Faber predicting crashes, disasters, and collapses over the last 13 years.
The S&P 500 Starts Q2 With An All-Time High
The first day of the second quarter ended with the S&P 500 breaking through 4,000 to close at an all-time high of 4,019.87. Rounding up, that's four thousand twenty reasons to ignore permabears. It's one thing to hedge against downside risk - we've been big advocates of that (more on that below) - but betting on a collapse because you're negative about politics or the government is a recipe for losing money.
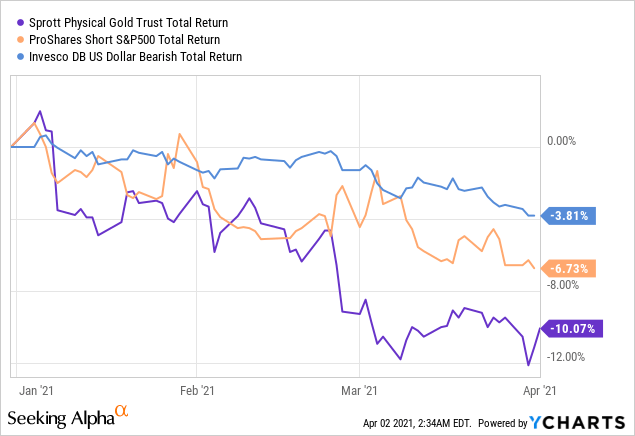
There were certainly reasons to be cautious at the end of last year - there always are. But if you bet against the market and the dollar and bet on gold then, you've taken L's on all three since.
The Markets Versus The Real World
Markets impact the real world and vice-versa. George Soros spends lots of words explaining this under his theory of "reflexivity", but it's easier to explain with a couple of examples. The real world impacting the market is an easy one: Russia invaded Finland in 1939, and Finish bonds tanked. But markets impact the real world too. A recent example was the WallStreetBets crowd bidding up the price of AMC shares. That enabled AMC to float a secondary offering, raising money to keep the theater chain in business. Thanks to a bunch of Robinhood traders, movie theaters stayed open in the real world.
Although markets and the real-world impact each other to some extent, markets are not the real world. A lot of negative things that happen in the real world have no impact on the market, and vice-versa. For example, we've written recently about the anarcho-tyranny in America's cities, and how depraved teens murdered an immigrant working a sub-minimum wage in our capital. Terrible stuff, but it has no impact on the stock market, and another new high in the S&P 500 won't impact that terrible stuff either.
Japan As Another Example
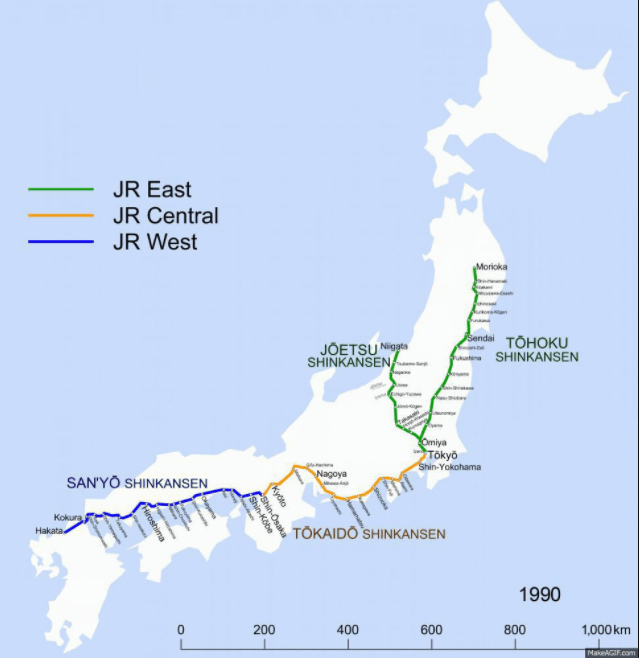
Japan offers another example of the distinction between markets and the real world. In February, the Nikkei 225, Japan's main stock index, crossed above the 30,000 level for the first time since 1990. For thirty years, Japanese stocks went nowhere, but that doesn't mean Japan went nowhere. They kept improving their enviable country. Compare, for instance, their bullet train network in 1990...
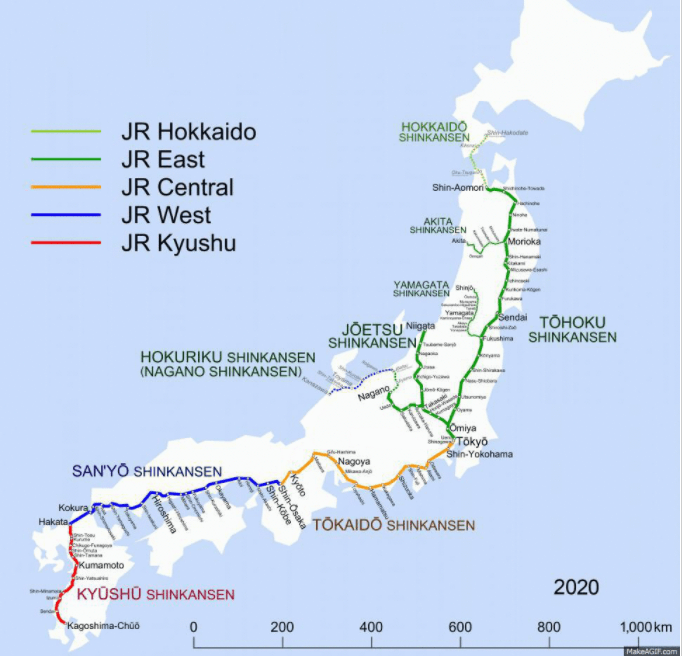
To their network in 2020.
Investing In A State Of Fear
There are always real-world concerns to worry about, and some of them (not our recent upturn in crime, unfortunately) impact the market. The way to deal with that is not to reflexively bet on doom or hoard gold. Our approach to investing in a state of fear is to buy likely winners and hedge away the fear.
Let's say that you had $3,000,000 in cash you wanted to put to work in 2021, but you weren't willing to risk a drawdown of more than 20% (you can use our system for portfolios as small as $30,000 as well). If you indicated that in our hedged portfolio construction tool on Christmas Eve,
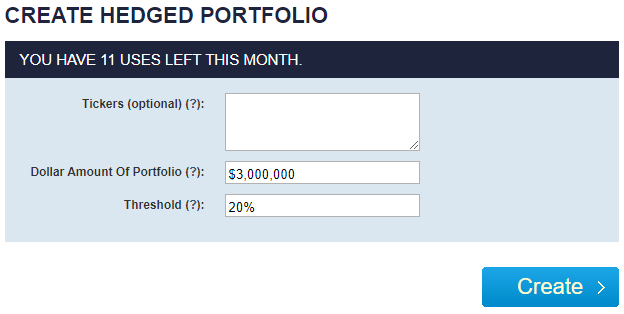
This and subsequent screen captures are via Portfolio Armor.
This is the portfolio it would have presented to you.
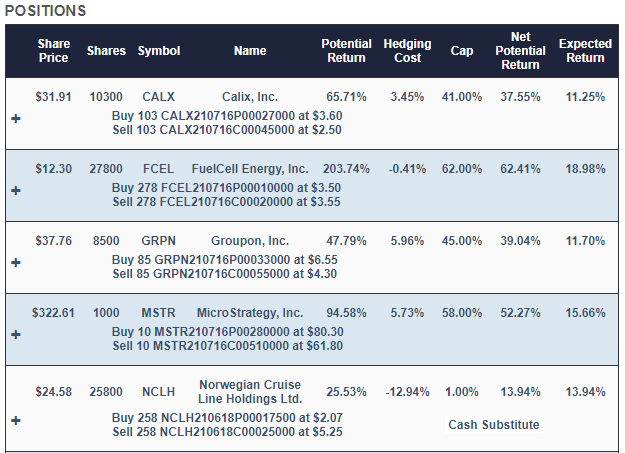
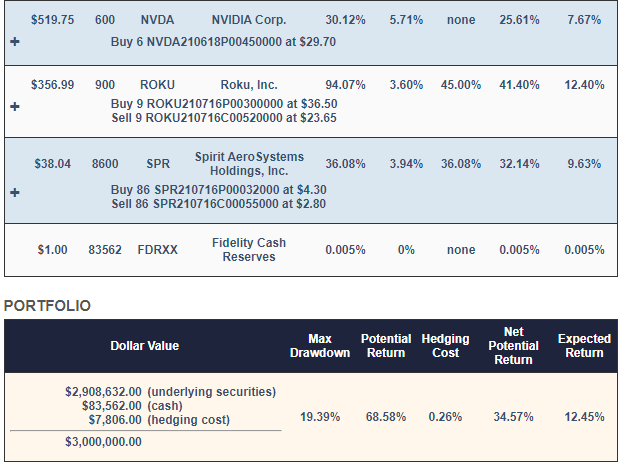
With this, your maximum drawdown over the next six months - that is, if every underlying security went to zero - would have been a decline of 19.39%. Your best-case scenario would be a gain of about 35%, and your expected return (a more likely scenario) would be a gain of about 12%.
Why Those Names?
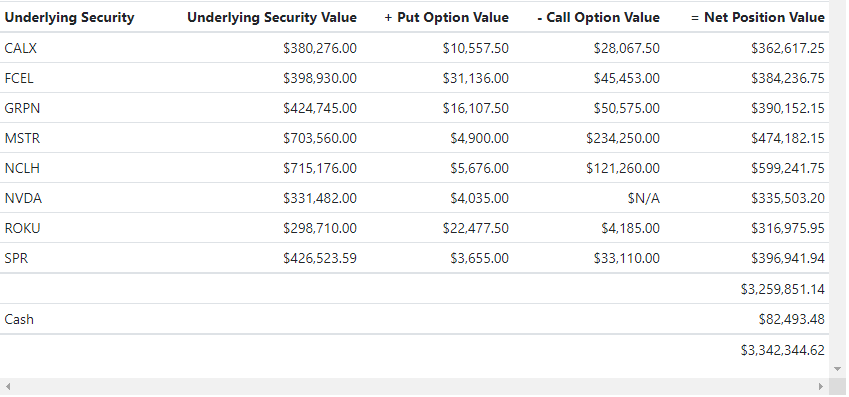
Calix (CALX), FuelCell Energy (FCEL), Groupon (GRPN), MicroStrategy (MSTR), Nvidia (NVDA), Roku (ROKU), and Spirit AeroSystems (SPR) were selected because they were among our top names - the ones that had the highest potential returns, net of hedging costs when hedging against a >20% decline. Our system started with roughly equal dollar amounts of each, and then rounded them down to round lots, to reduce hedging costs. It swept up most of the leftover cash from the rounding-down process into a tightly hedged Norwegian Cruise Lines (NCLH) position, to further reduce hedging cost.
Why Those Hedges?
On our website, if you click the plus signs in the portfolio above, the positions expand to give you a better look at the hedges. For example, this is what the CALX position looked like expanded.
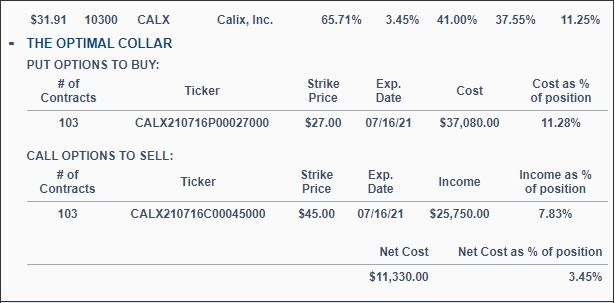
CALX was hedged with an optimal, or least expensive, collar. One of the other positions was hedged with optimal puts. Our system estimates returns both ways to determine which type of hedge is best. We elaborated on that process in a recent post: When To Hedge With Puts Versus Collars.
How That Hedged Portfolio Has Done So far
Here's the performance so far of that hedged portfolio as of Thursday's close, net of hedging, and trading costs.
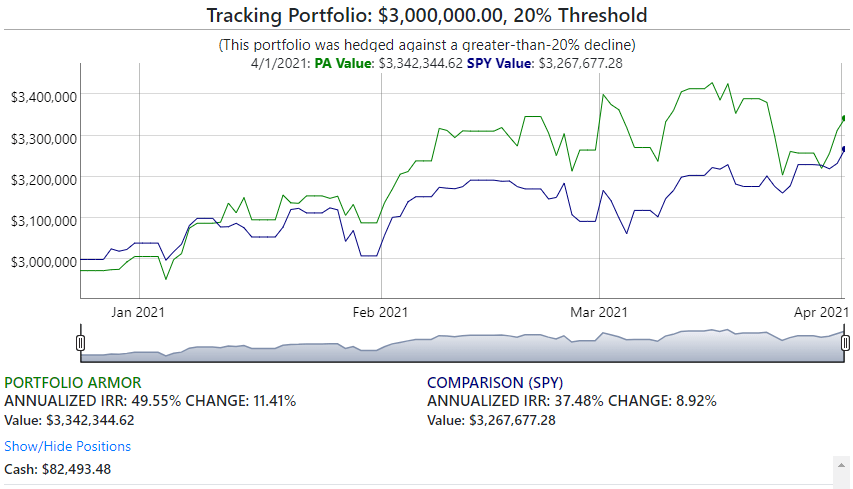
As of Thursday, that hedged portfolio was up 11.41% (in the ballpark of the expected return we estimated for it ahead of time) while SPY was up 8.92%.
Another Approach
In our hedged portfolio method, we aim to generate competitive returns at all risk tolerances and, ideally, to beat the market at higher risk tolerances, as the portfolio above is doing so far. If you'd rather hold a diversified portfolio and just hedge against market risk, we wrote about how to do that in our previous post: Buying Umbrellas When It's Sunny Out. As we noted there, with volatility dropping and the market hitting a new high, this is a good opportunity to hedge inexpensively. If you'd rather skip to our demo video on that, here it is.
We use our iPhone app in that demo, but you can also use our website to scan for optimal hedges on index ETFs ...
more

