Flatten The Funhouse Mirrors
Let’s suppose you were about to head outdoors, and you asked me the temperature so you could dress appropriately. “It’s thirty-two”, I tell you. So you slip on a thick coat, a scarf, and a hat, then you head outside.
After you shut the door behind you, the hot air hits you, and you immediately come back inside, furious with me, and change into something more comfortable. I was telling you the truth – – the temperature was, in fact, 32. Celsius. In other words, you should be wearing a short-sleeved Tommy Bahama top and not a thick coat.
Similarly, you might ask me what my father’s salary was when I was a kid. “Thirty-five thousand dollars.” Wow, pathetic, right? How did he support a family of six, and we lived in a nice house? Well, the salary I am telling you about was from decades ago, and it was pretty good money back then.
It’s a matter of scale. 100 degrees Celsius and 212 degrees Fahrenheit are the same thing, but the numbers by themselves aren’t meaningful without proper scaling. If I tell you it’s “100” outside, you actually might be one of those people who enjoy that kind of weather. But if I didn’t tell you it was Celsius, you might want to get your affairs in order before strolling outdoors.
The reason I’m bringing this up is because stock prices, in nominal dollar-denominated terms, are misleading. Stock prices in the U.S. are expressed in dollars, and dollars are not a constant, immutable measuring stick. On the contrary, the quantity of dollars in the U.S. has been exploding, courtesy of the fine folks housed in the Eccles Building. It’s not like they’ve made a secret of it, either, as their own data reveals:
(Click on image to enlarge)
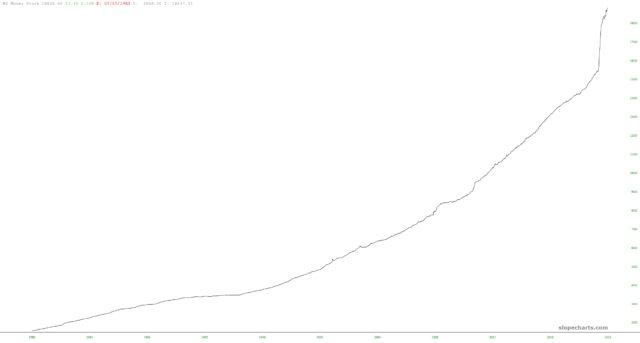
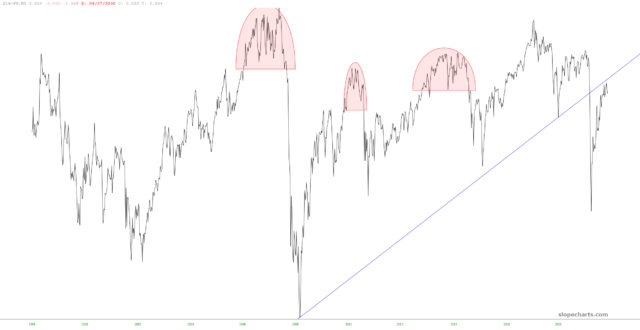
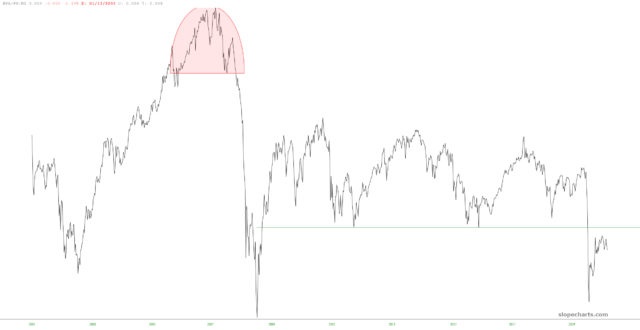
Thus, I think it’s vast more valuable to view market data through the lens of something closer to a true, unchanging measuring stick, as opposed to pretending the M2 money supply, illustrated above, is a reliable constant. Here, then, are a series of important ETFs, each of them expressed as a ratio versus M2. I think you’ll find them an illuminating illustration of why, in spite of “New Highs” this and “S&P to 4500”, in many ways stocks aren’t really any more valuable than they were even decades ago.
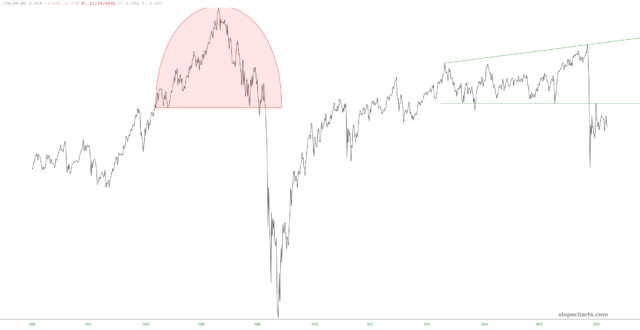
DIA (Dow Industrials):
(Click on image to enlarge)
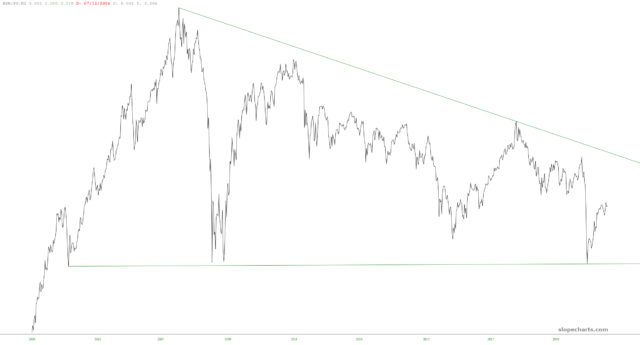
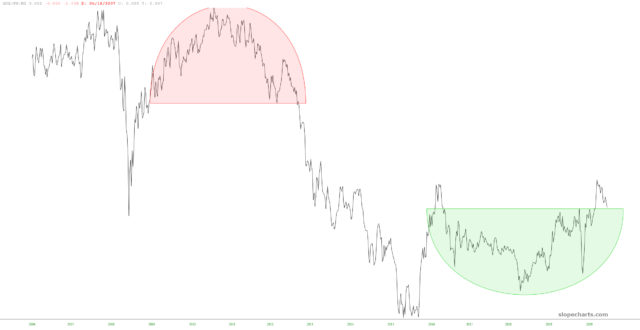
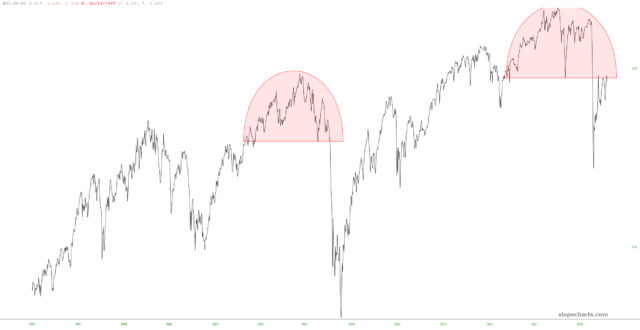
EEM (Emerging Markets):
(Click on image to enlarge)
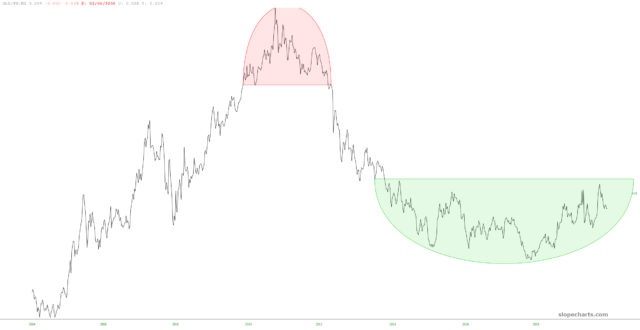
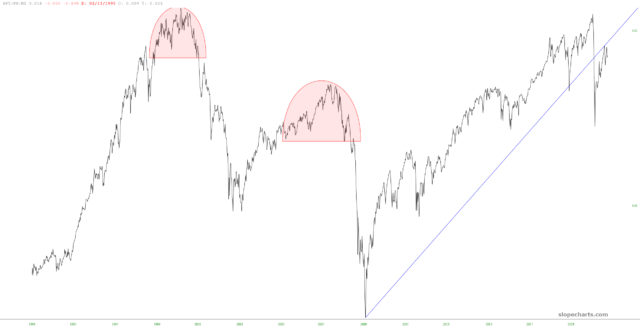
EFA (Europe MSCI):
(Click on image to enlarge)
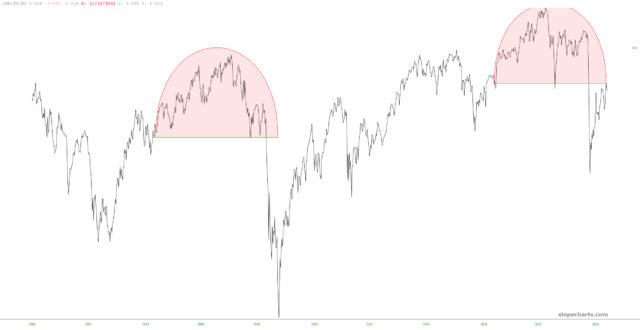
GDX (Gold Miners):
(Click on image to enlarge)
GLD (Gold):
(Click on image to enlarge)
IWM (Small Caps):
IYR (Real Estate):
(Click on image to enlarge)
MDY (MidCaps):
(Click on image to enlarge)
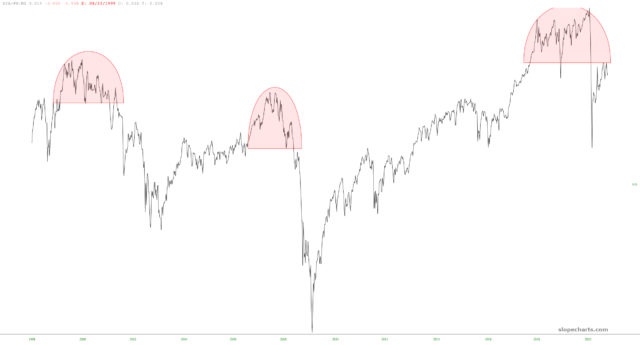
SPY (S&P 500):
(Click on image to enlarge)
XLB (Materials):
(Click on image to enlarge)