
Finding Alpha In Options Market Sentiment
An Anzani 10-cylinder radial aircraft engine (image via Wikimedia Commons).
Switching To Four Cylinders
Six months ago, we changed the way we selected our top names. We had already determined that we could find alpha by using hedging cost to analyze options market sentiment. Among our top ranked names, securities that could be hedged against >9% declines with optimal, or least-expensive, puts expiring in approximately 6 months tend to significantly outperform those that couldn't be hedged that way over the next 6 months. We'd been calling those "AHP" ("Also Hedgeable with Puts") for short. What we did starting on November 20th was drill down further, looking at the performance of securities that were also hedgeable against even smaller declines with optimal puts.
Limited Data
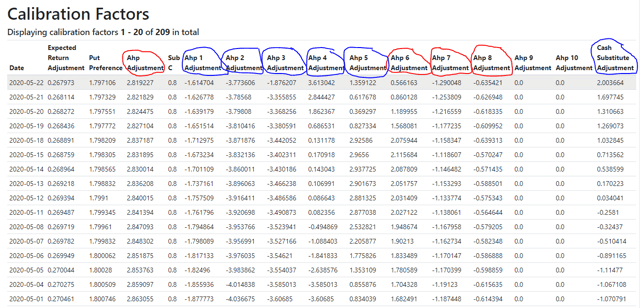
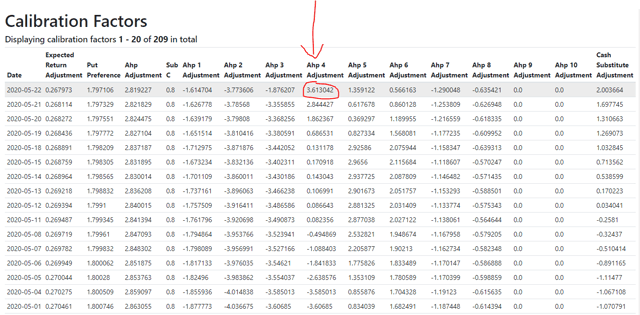
One problem was we had limited data about securities hedgeable against declines of less than 6%, because those had rarely showed up among our top names under our old approach. So, in November, our security selection process was informed by the four calibration factors circled in red below.
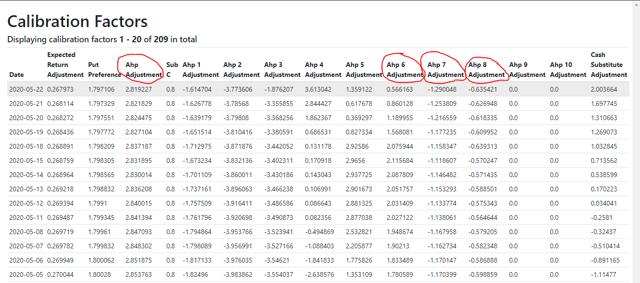
We had data on names that were hedgeable against >6%, >7%, >8%, and >9% declines with optimal puts expiring in approximately 6 months. As far as calibration factors were concerned, we had a four cylinder engine.
New Data Starts To Pour In
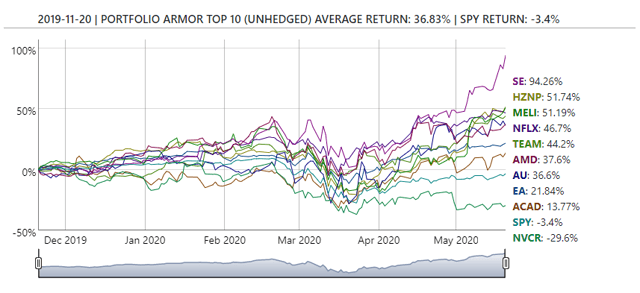
Giving preference to securities hedgeable against >6% declines starting in November meant that we ended up with some names that were also hedgeable against even smaller declines. For example, all of our top 10 names on November 20th were hedgeable against >6% declines, but two of them, Anixter AXE and the SPDR Gold Trust ETF GLD were also hedgeable against >4% declines.
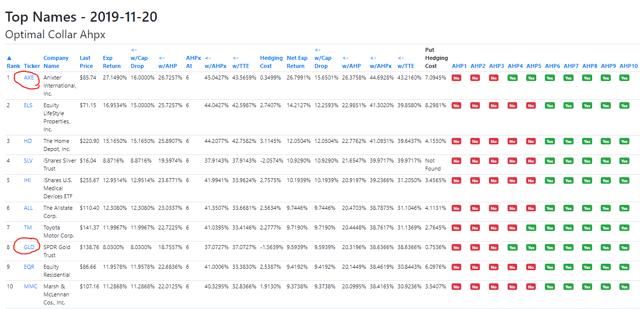
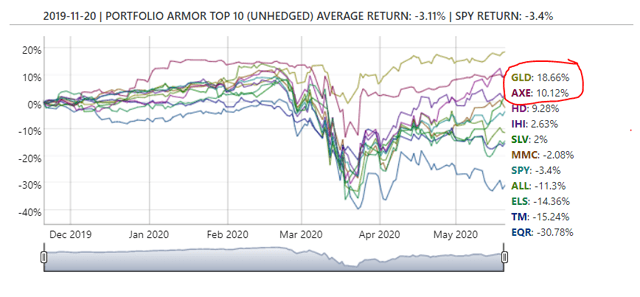
On May 20th, 6-month performance data started pouring in from the new approach. The top performers from that top names cohort were the two hedgeable against >4% declines, GLD and AXE.
At the same time, we've been tracking the performance of our "cash substitutes" list. These are names that are expensive to hedge with puts, but generate large net credits when tightly collared. We actually started tracking the performance of these a few months earlier, cash substitute performance began to explode higher in November. Here's the performance of the November 20th cohort.
The Apparent Paradox
This is the apparent paradox I mentioned before (The Andromeda Strain Paradox), in which both low risk and high risk names (as measured by the cost of hedging them with optimal puts) have outperformed.
Switching From Four Cylinders To Ten
As 6-month performance data continues to pour in from both the cash substitutes and top names lists, our options market sentiment engine is expanding from 4 cylinders to 10. The 6 columns circled in blue are now joining the 4 ones in red in informing the selection of our top names.
Outperformance Of Conservative Portfolios Explained
All else equal, you would expect that if you take on more risk, you have higher return potential. An oddity of our recent hedged portfolio performance has been that the best performers have been portfolios hedged against >4% declines. Here, for example, is the performance of our November 21st 4% threshold portfolio:
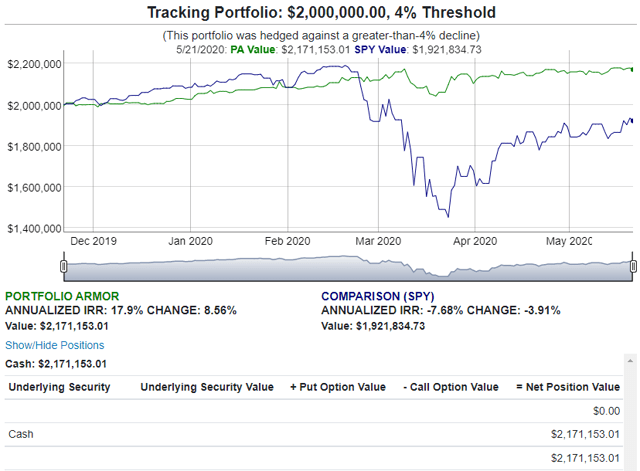
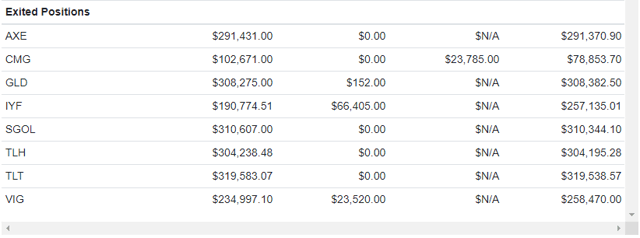
That portfolio was up 8.56% over 6 months, while the SPDR S&P 500 ETF SPY was down 3.91% over the same period. Three of the last four portfolios hedged against >4% declines had performance as good or better, as you can see in the table below (click on a starting date for an interactive chart similar to the one above).
PORTFOLIOS HEDGED AGAINST > 4.0% DECLINES
| Starting Date | Expected Return | Actual Return | SPY Return |
|---|---|---|---|
| May 9, 2019 | 1.85% | 2.03% | 8.80% |
| May 30, 2019 | 1.82% | 5.70% | 13.72% |
| July 11, 2019 | 3.34% | 3.72% | 9.86% |
| July 25, 2019 | 2.46% | 3.68% | 10.64% |
| August 1, 2019 | 3.66% | 2.55% | 10.16% |
| August 8, 2019 | 3.19% | 1.75% | 14.22% |
| August 15, 2019 | 1.76% | 0.36% | 19.74% |
| August 22, 2019 | 3.06% | 3.07% | 15.15% |
| August 29, 2019 | 2.76% | 1.73% | 2.23% |
| September 5, 2019 | 2.56% | 4.19% | 2.55% |
| September 12, 2019 | 2.40% | 2.71% | -16.86% |
| September 29, 2019 | 1.32% | 1.88% | -13.26% |
| October 3, 2019 | 1.82% | -0.13% | -13.60% |
| October 10, 2019 | 1.43% | 1.98% | -4.08% |
| October 17, 2019 | 1.50% | 4.30% | -3.16% |
| October 24, 2019 | 1.63% | 1.97% | -4.75% |
| October 31, 2019 | 1.86% | 9.84% | -3.18% |
| November 7, 2019 | 4.01% | 3.88% | -5.62% |
| November 14, 2019 | 1.28% | 9.23% | -6.92% |
| November 21, 2019 | 1.90% | 8.56% | -3.91% |
| Average | 2.28% | 3.65% | 1.59% |
Now look again at our calibration factors below. Notice which of the AHP factors has the highest outperformance: the AHP4 one.
Two Poles Of Alpha
We'll see where the data takes us, as always, but the resolution to the apparent paradox of high and low risk names outperforming appears to be that there are two poles of outperformance: one with securities that are too expensive to be hedged against >9% declines with optimal puts at all (the cash substitutes list), and one with securities that can be hedged with puts against single-digit declines. Six months ago, it looked like the second pole centered on names hedgeable against >6% declines; now it looks like it's centered on names hedgeable against >4% declines.


