
EXC Option Activity A Good Sign For Utilities
EXC Unusual Option Activity Report
If you’ve been watching Treasury bonds lately, it’s been brutal and, as a result, utilities like Exelon Corporation (Nasdaq: EXC) haven’t done well. See, this type of rising interest rate market favors low-duration companies. However, as the 10-year U.S. Treasury bond yield approaches 1.5%, it may start to trigger rotation into high duration sectors like utilities. At least, that’s what the option activity on EXC is potentially indicating.

What is Duration?
One of the biggest indications of interest rate risk in the bond market is duration, but what about stocks like EXC and others? The concept of duration is also applicable to stocks in a similar fashion. In order to grasp the concept, let’s start with bonds.
For those that have traded options, you’re probably comfortable with the concept of delta. Delta measures the amount the option price will change with a $1 move in the stock. You may have not been aware that duration is a similar measure for bonds. It represents the amount the bond price will change with a 1% move in yield.
If inflation expectations are rising, typically lower duration and lower credit quality is preferred. In the event inflation expectations are falling, it would favor higher quality longer duration bonds. If you look at how Treasury bonds have performed to high yield credit, you’ll see that this rule of thumb has worked as commodity prices are exploding higher (an indication of inflation).
As you translate this to stocks, your lower beta names like EXC that pay a dividend would be similar to high-duration U.S. Treasuries. High beta technology and commodity names would be considered low duration. As a result, the impact of rising treasury yields, and falling high yield risk spreads has favored a riskier mix of assets.
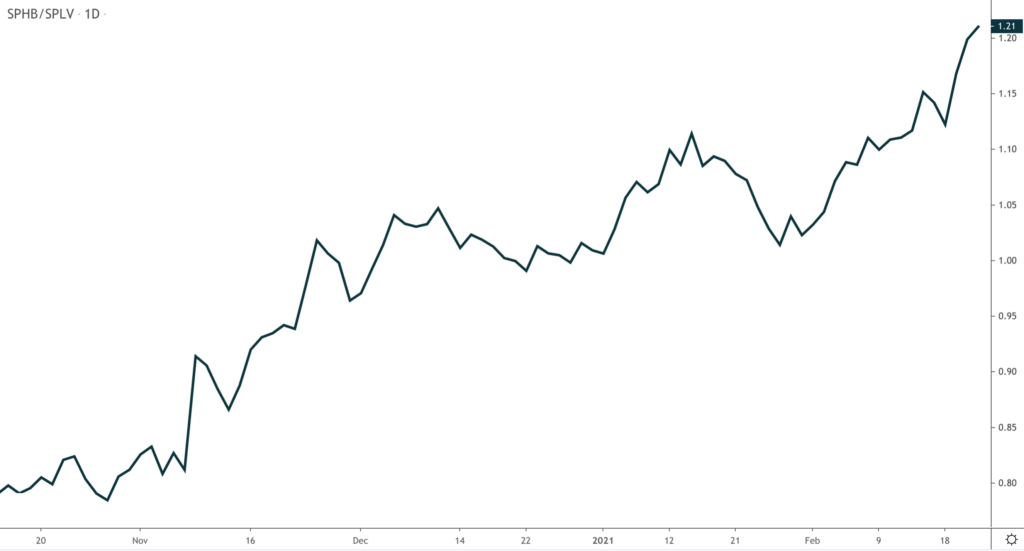
In the chart below, you’ll see a ratio of Invesco S&P 500 High Beta ETF (NYSEARCA: SPHB) to the Invesco S&P 500 Low Volatility ETF (NYSEARCA: SPLV). As you’ll see by the rising line, the market has been favoring higher beta names over the past many weeks.
(Click on image to enlarge)
EXC Option Activity
The option activity today was five times its 5-day average. Call option volume was nearly six times the average with a put-to-call ratio of 0.07. Digging a little deeper show that 70% of the over 20,000 call contracts were filled at the ask price, This is a strong indication of call option buying, Here’s a breakdown of the significant activity.
- 14,245 19 MAR 21 calls mostly BOT in three prints @ $0.54 to $0.75 against open interest of 1,197
Most of the volume came in three large prints of 5,000, 2,997, and 1,143 contracts in the middle of the trading session. The strike and expiration selection gives a near-term expected move to the upper end of the trading range above $43.
EXC Technicals
Since the October high, EXC has been trading in a range of around $40 to as high as $44. As the price is currently testing the depth of support, the price formed a bullish harami candle pattern. This candle formation is an early indication of support.
(Click on image to enlarge)

With the price trading at support and starting to firm up, the introduction of bullish option activity targeting the upper end of the range presents an intriguing setup.
Conclusion
High-duration, interest-rate-sensitive stocks like EXC have had a rough go of it during the Treasury route. Today’s option activity may be an early indication of that trend reversing a little in the near-term. While it may not be calling an end to the bull market. Any pull-back in yield should allow utilities to gain some footing.
Disclaimer: Neither TheoTrade or any of its officers, directors, employees, other personnel, representatives, agents or independent contractors is, in such capacities, a licensed financial adviser, ...
more

