
Evaluating The Efficacy Of The Model That’s Flashing Green On Many 2040-FANMAG Themed ETFs
My last post discussed the Thematic Global ETFs and their potential to point today’s investors toward stocks that may become the FANMAG of 2040. I provided access to a spreadsheet identifying 97 of them and in the text of the article, I named 16 ETFs as being rated Bullish or Very Bullish under the Chaikin-Analytics-PortfolioWise Power Ranks we use to evaluate the relative future performance potential of ETFs. (The list of favorably-rated ETFs will be reproduced below.) My goal today is to explore the nature and current efficacy of the model we use to rate these ETFs.

5-Stars © CAN STOCK PHOTO / JIRSAK
Ranking ETFs For Probable Future Performance
For starters, here is what we do not do: We do not take various measures of historical price changes, sort, and say the largest changes are best. We, like many or most others, display such information, but it is strictly informational. We agree wholeheartedly with the well-known mantra that past performance does not assure future outcomes.
But we, like everyone else, want to predict the future even though we and the rest of humanity lack the gift of extra-sensory psychic vision of tomorrow. (Actually, I do have a crystal ball that is forecasting blowback from the 1-800-whatever psychic community! Whatever.) The goal here is to work with probabilities; to identify factors we believe, based on the combination of theory and empirical observation (with a particularly heavy dose of the former — we do not practice “curve fitting” or “data mining”).
Click here for a “white paper” explaining the Power Rank model in detail.
Starting With The Stocks
Where an ETF consists of US equities, it makes sense to start with the Chaikin Power Gauge ranks we compute for stocks. It seems reasonable to assume that the Power Rank for an ETF like the SPDR S&P 500 ETF (SPY), which is a portfolio of stocks, will be the average of the ranks of the individual stocks weighted as they are in the SPY portfolio.
Actually, it’s not so simple. If you’ve taken a finance class, chances are you are already primed to accept the notion that the whole may not equal the sum (or even the weighted sum) of the parts. If you don’t believe me, answer on an exam that Portfolio Variance is equal to the weighted average of the Variances of the individual securities and see how the instructor reacts. (If you’d rather not walk the plank to find out, click here to see the correct formulation, which requires more information.).
Beyond that, when we get into advanced statistical methods of analysis, there is something known as “residual error,” which refers to the impact of unknown factors not accounted for in the model. When quants do what quants do, they try to get residual error as close to zero as possible and often assume it out of the picture by treating. it as a random thing that over the long term averages to zero. That’s all well and good — until you use a model to invest real money in which case you find that residual error is neither random nor zero and can cause a lot of financial pain.
We Need More
So, while we use stock-specific Power Gauge ranks in our ETF model, we go a lot — a heck of a lot — further. Under ideal conditions (i.e., the ETF owns only US stocks that are rankled by us), the portfolio weighted average Power Gauge rank is only 20% of the overall ETF rank. Another 20% of the rank is based on a different sort of analysis of the distribution of ranks within the ETF portfolio. And 60% is based on our ETF Technical model. (Yes, even for an ETF like SPY, 60% of its rank is based on technical indicators).
For ETFs that don’t own US stocks (including fixed income ETFs), or for which US stocks are too small a portion of the portfolio to warrant stock-specific analysis, the Technical rank is 100% of the primary score. All ETF scores are then subject to checks for continuity from one week to the next, and another final safety-valve check based on an additional layer of technical analysis.
Technical Analysis: Seriously? Yes!
Technical analysis has attracted a lot of bashers who, as far as I can see (and I’ve seen a lot in my decades worth if experience) have shown themselves to be masterful at creating colorful and entertaining quips but woefully lacking in their understanding of what technical analysis actually is and how its practiced by legitimate practitioners as opposed to hucksters most skilled at playing “look at me” to big crowds.
I’m going to come at the definition from a non-traditional angle. Have you ever considered how many stars something has on Amazon, Yelp, Goodreads, Trip Advisor, Seamless, Expedia, etc. etc. etc. If you have, congratulations, you’re using technical analysis . . . not to evaluate stocks or ETFs but to do something different, but analogous. You’re using a wisdom-of-the-crowd approach to tap into the collective experience and judgment of many in order to supply perspective that assists you in making your own judgment. Maybe you’ll agree with the crowd. Maybe you won’t. Maybe the crowd is wrong. Maybe it’s right. Nothing is infallible. It’s all a blending of probabilities and judgment.
Whether using Yelp or technical analysis, you can never be naive about it. With Yelp, for example, read some reviews, especially extreme reviews. Do they seem credible. Or did one guy trash the average star rating of a restaurant with genuinely good food because one delivery arrived ten minutes late? On Goodreads, did somebody give one-star to a character-driven literary novel that they shouldn’t have read in the first place because they usually prefer best-sellers with fast-moving plots? When looking at a stock, does an up trend in price truly signal pure bullishness, or are there clues in the way prices behave (especially as they relate to intra-day changes and volume-related measures) that suggest investors are starting to get antsy and losing conviction in the views they had recently held?

Technical Analysis © CAN STOCK PHOTO / DOLGACHOV
I’m not a good enough philosopher to expound more elaborately on the theory of crowd-based analysis. For that, I’ll defer to the likes of James-Surowiecki and his book that’s actually entitled “Thge Wisdom of Crowds.” When I was younger and something of a smart-you-know-what, I doubted this sort of thing preferring instead to stand on my own unique genius. Then, I grew up. And the longer I’ve been in investing, the more I’ve come to realize that I’m not the only smart person in the world (and lest I foreget, I have a wife who’s ready, willing and able to remind me I’m not even in the top . . . skip it) and that there is a lot to learn by tapping into the views of others, including in this context, Mr. Market. As cute as may be the Ben Graham/Warren Buffett spiel about how Mr. Market is a manic depressive loser (and it is quite cute), the reality for anyone who has been awake in the past 30 years is that the real Mr. Market of today is wide awake and incredibly well informed (the information age is so well established, we take it for granted and no longer marvel at it). Mr. Market isn’t always right. Nobody is. But Mr. Market is definitely not ignorant.
Mr. Market’s Language
Technical analysis is all about speaking Mr. Market’s language (stock prices, volume, trends and indicators based thereon), hearing what he is saying, and evaluating it consistent with your own goals, risk tolerances, and views of the world. (I’m actually surprised efficient-market academics aren’t more into technical analysis. They, as I recall, are the ones who keep saying you shouldn't try to pick stocks because you can’t know more than the market already knows. Oh wait. I think I figured it out. They can’t figure out how to beat the market, but it makes for a better paper if they say it’s because nobody can do it. Maybe if they’d actually learn fundamental and technical analysis . . . .)
Mr. Market’s language has two dialects.
- One is known as “trending.” When we speak this way, we adopt the perspective that trends in place tend to remain in place, and we look for expressions from Mr. Market that confirm this to be so, or changes in body language, tone ec. that suggest the trend may not be what it once was and may be readying for change.
- The other dialect is known as “oscillating.” Here, we’re oriented toward back and forth movement as stocks reach extremes and correct by moving toward the middle (and often overshoot equilibrium on the other side and reach a new opposite extreme that needs to correct, and so on and so forth). Statisticians translate this to “mean reverting” or “reversion to the mean.”
The Power Rank Technical algorithm contains contains three proprietary parts, a trending portion with a longer-term orientation is the biggest component of our approach, there’s a second trending portion with more of an intermediate flavor and an oscillator with a shorter-term perspective. The oscillator is the smallest part of the model. So expect our Power Ranks to have a primarily trending orientation.
Global Thematic ETF Rank Performance
The data here covers the period 9/28/18, which is when our Power Ranks were publicly launched, to the present. We backtested almost 20 years, but I’m not showing any of that. All the information shown here reflects live (or in statistical parlance, “out of sample”) results.
Table 1 shows the performance of three groups of my collection of Global Thematic Equity ETFs.
Table 1
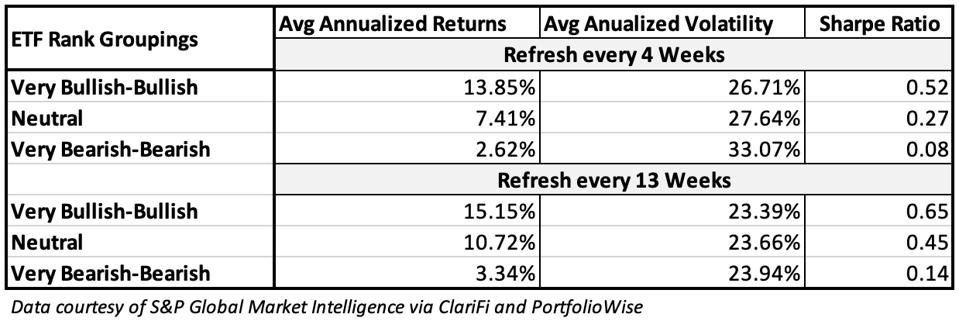
Table 1 AUTHOR
Table 2 analyzes the differences between the Bullish- and Bearish-ranked groups
Table 2
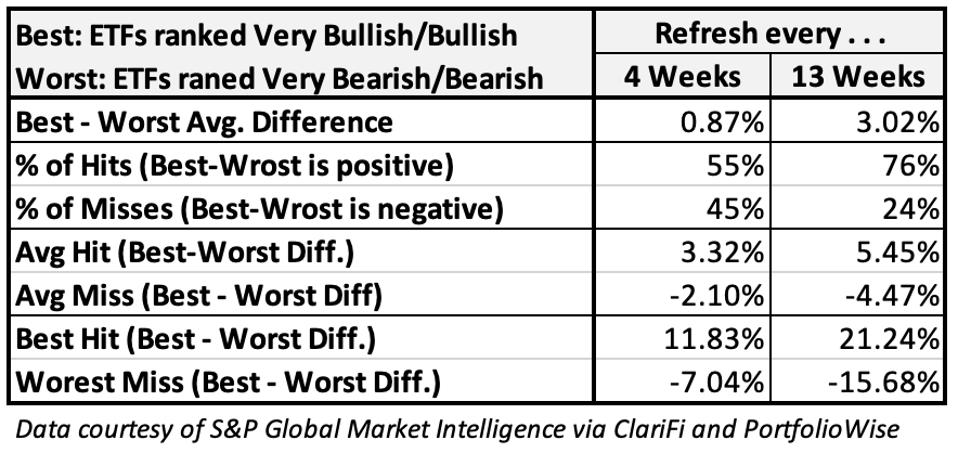
Table 2 AUTHOR
I’ve seen many tables like these and the ones presented here today are as strong as any I can recall. I’d love to be able to say it will always be this good, but I sensibility must reign. As noted, our Power Ranks are primarily trend oriented, so the persistency of the relevant trend has done wonders for rank performance shown here.
While we can’t ever assume any trend will persist uninterrupted and forever, these trends (emphasis on strategies that could potentially lead to the FANMAGs of 2040, as discussed last week) have gone on for a while and could continue to have legs into the future, assuming these ETFs continue to do well in stocking their portfolios with shares of companies that genuinely reflect the themes they pursue. But in terms of rank efficacy, I am encouraged to see that our model has, even during this powerful period for this group, been picking up messages from Mr. Market regarding those thematic plays that have not executed quite as well. In other words, Mr. Market has been doing a good job of warning us as to which of these great-on-paper ETFs should be avoided.
The risk, I believe, lies in valuations of stocks owned by the ETFs. It’s OK for valuation ratios to be and remain high, even extremely high, if . . . and this is an important “if” . . . future growth expectations and company risk remain such as to justify the high valuations. (Click here for more on the way value, growth expectations and quality/risk interact.) Back in 1999-2001, stock valuations ran ridiculously beyond the outer edge of any sort of rational set of expectations regarding growth and/or risk. If that were to happen again, we’d expect to see more warnings in stock Power Gauge ranks and in the messages being delivered by Mr. Market via our Technical ranks. Although valuations for many stocks owned in these ETFs are high, I don’t presently see them being nearly as exorbitant as they’d need to be to call the value police into action. But if you invest in ETFs like these, as do I, this is the thing to monitor going forward.
The ETFs
Many Global Thematic ETFs are ranked favorable. Here are the well-ranked ETFs IO listed last week:
- ALPS Disruptive Technologies (DTEC)
- Amplify Online Retail (IBUY)
- ARK Fintech Innovation (ARKF)
- Bluestar Israel Technology (ITEQ)
- ETFMG Prime Cyber Security (HACK)
- ETFMG Video Game Tech (GAMR)
- FlexShares Stoxx Global ESG Impact (ESGG)
- Global X Cloud Computing (CLOU)
- Global X Health & Wellness (BFIT)
- Global X Lithium & Battery Tech (LIT)
- Invesco Global Water (PIO)
- KraneShares Electric Vehicles and Future Mobility (KARS)
- ProShares Pet Care (PAWZ)
- Robo Global Robotics and Automation (ROBO)
- Sofi Gig Economy (GIGE)
- Vaneck Vectors Agribusiness (MOO)
- Vaneck Vectors Low Carbon Energy (SMOG)
One of the ETFs I listed has a Neutral rank:
- FlexShares Stoxx Global Broad Infrastructure Index (NFRA)
This ETF is ranked Bearish, but because of its unique theme deserves at least a place on watch lists.
- Procure Space ETF (UFO)
Disclosure: I am long ARKF, PAWZ.


