
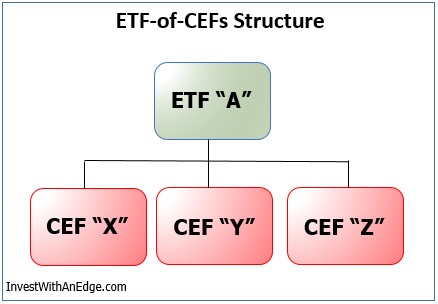
ETFs-of-CEFs
Closed-end funds (“CEFs”) are different animals from exchange-traded funds (“ETFs”) and traditional mutual funds. CEFs do trade on an exchange, like stocks and ETFs, which leads to some confusion. However, they cannot create and redeem shares in response to changes in demand, and therefore are not ETFs. Investing in CEFs can be potentially lucrative, but investors need to be keenly aware of the price premiums and discounts, which are sometimes extreme, that typically accompany these investment vehicles. ETFs-of-CEFs provide an alternative approach for investors. Similar to fund-of-funds ETFs, these ETFs provide a portfolio of closed-end funds, greatly simplifying the process for investors.
Before jumping into the details on ETFs-of-CEFs, it is probably helpful to understand the world of closed-end funds. The key feature that makes an ETF an ETF is its ability to create and redeem shares. This, along with the continuous publishing of its intraday net asset value constitutes the soul of an ETF. These features provide the tools that allow professional arbitrageurs to keep an ETF’s trading price closely aligned to its net asset value throughout the day. If the creation/redemption mechanism is not functioning properly, then it becomes a “broken product” where premiums and discounts can develop. Traditional mutual funds only “trade” once per day at the closing, but all purchases are netted against all sales to determine how many shares need to be created or redeemed, so they also have a creation and redemption process.
However, closed-end funds generally do not create or redeem shares, except under special circumstances. The quantity of shares remains fixed, or “closed,” and trade independently of the underlying net asset value. Without the ability to create or redeem shares, there is no way to prevent price premiums and discounts from developing. This is the primary complaint about CEFs, and the reason why ETFs have greatly surpassed them in popularity.
Although this may seem like an obscure category of ETFs, there are eight such products currently on the market. When reporting expense ratios, the SEC generally requires ETFs and mutual funds to include the expenses of any other funds they hold. Therefore, the total expense ratios of ETFs-of-CEFs are composed of both a management fee for the ETF itself and the acquired fund fees for the CEFs it is holding. This gives these funds the appearance of higher-than-average expense ratios, but keep in mind that the reported yields and total returns are net of these fees.
Here are brief descriptions of the eight ETFs and ETNs that provide exposure to CEFs, listed in order of largest assets:
- PowerShares CEF Income Composite (PCEF), launched 2/19/10, tracks an index of closed-end funds that invest in taxable investment-grade fixed-income securities or taxable high-yield fixed-income securities, or utilize an equity option writing (selling) strategy. It has 140 holdings, $670 million is assets, and a current yield of 7.3%. PCEF has a management fee of 0.50% and acquired fund fees of 1.52% for a total expense ratio of 2.02% (PCEF overview).
- ETRACS Monthly Pay 2x Leveraged Closed-End Fund ETN (CEFL), launched 12/11/13, is an is an exchange-traded note (“ETN”) issued by UBS linked to the monthly compounded 2x leveraged performance of the ISE High Income Index of 30 CEFs, making it a leveraged version of the YieldShares High Income ETF (YYY) described below. This ETN has $261 million in assets, an investor fee of 0.50%, with the acquired fund fees being accounted for in the underlying index. The 2x leverage boosts both the price return and yield, with the ETN currently kicking off a 13.5% yield. The leverage and ETN structure are not for the faint of heart, and investors should fully understand these risks before investing (CEFL overview).
- YieldShares High Income (YYY), launched 6/12/12, tracks the ISE High Income Index of 30 CEFs ranked highest overall in fund yield, discount to net asset value, and liquidity. Its $154 million in assets currently have 75% exposure to bonds and 25% to stocks, producing a yield of 7.0%. YYY has a management fee of 0.50% and acquired fund fees of 1.36% for a total expense ratio of 1.86% (YYY overview).
- VanEck Vectors CEF Municipal Income (XMPT), launched 7/13/11, tracks an index of U.S.-listed CEFs that invest in U.S. dollar-denominated tax-exempt securities. It has 71 holdings, $80 million in assets, and a tax-exempt yield of 5.0%. It has a management fee of 0.40% and acquired fund fees of 1.16% for a total expense ratio that is capped at 1.56% (XMPT overview).
- First Trust CEF Income Opportunity (FCEF), launched 9/28/16, is an actively managed ETF with an objective of providing current income by investing in U.S.-listed CEFs. It has 40 holdings, $18 million in assets, and a current yield of 6.4%. It has a management fee of 0.85% and acquired fund fees of 1.65% for a total expense ratio of 2.50% (FCEF overview).
- First Trust Municipal CEF Income Opportunity (MCEF), launched 9/28/16, is an actively managed ETF that invests in U.S.-listed CEFs investing in municipal debt securities. It has 35 holdings and $12 million in assets with a tax-exempt yield of 3.7%. MCEF has a management fee of 0.75% and acquired fund fees of 1.16% for a total expense ratio of 1.91% (MCEF overview).
- Claymore CEF Index GS Connect ETN (GCE), launched 12/10/07, is an ETN issued by Goldman Sachs linked to the performance of the Claymore CEF Index of 75 U.S.-listed CEFs selected for discount and yield. It has about $7 million in assets. It has an investor fee of 0.95%, and the acquired fund fees are accounted for by the underlying index. The underlying index has a yield of 7.74%, giving the ETN an estimated yield of 6.8%. This ETN should be avoided, as it is essentially an orphaned product without a website and a longtime member of ETF Deathwatch (underlying index overview).
- Saba Closed-End Funds ETF (CEFS), launched 3/21/17, is an actively managed ETF that seeks to generate high income by investing in CEFs trading at a discount to net asset value and hedging the portfolio’s exposure to rising interest rates. It has 30 holdings and $6 million in assets. Although the ETF is new, its first distribution has been announced, giving the ETF an estimated yield of 7.9%. It has a management fee of 1.10% and acquired fund fees of 1.32% for a total expense ratio of 2.42% (CEFS overview).
Directly investing in CEFs is an option for investors, but I am of the belief that it requires a distinct set of skills, along with much time and effort, to successfully select and manage a portfolio of CEFs. For that reason, these ETFs may be an optimal choice for investors seeking income from CEFs.
From a performance standpoint, three of the unleveraged funds have been in existence for about 4.8 years. During that time, YieldShares High Income (YYY) has returned about 7.7% a year with a standard deviation of 12.1%, PowerShares CEF Income Composite (PCEF) returned 5.8% with a 7.9% standard deviation, and VanEck Vectors CEF Municipal Income (XMPT) returned 4.2% at 8.8% standard deviation. However, the three-year performance results greatly favor XMPT. Additional performance, risk, and liquidity information can be found in the 2017 ETF Field Guide.
I have previously owned PowerShares CEF Income Composite (PCEF) and VanEck Vectors CEF Municipal Income (XMPT) and was pleased with the results. I recently purchased YieldShares High Income (YYY). For investors seeking income, ETFs that own CEFs are certainly worthy of consideration.
Disclosure: Author is long YieldShares High Income (YYY). No income, revenue, or other compensation (either directly or indirectly) is received from, or on behalf of, any of the companies or ETF ...
more

