
Emerging Markets Sell Signal
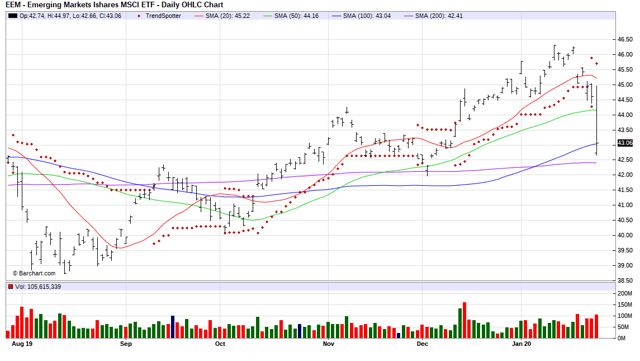
The Barchart Chart of the Day belongs to the Emerging Markets ETF (EEM). I had a 100 day moving average stop loss on both the Emerging Markets ETF (EEM) and the Frontier Markets ETF (FM) and the EEM stop loss triggered.
The iShares MSCI Emerging Markets ETF seeks to track the investment results of an index composed of large- and mid-capitalization emerging market equities. The ETF seeks investment results that correspond generally to the price and yield performance, before fees and expenses, of the MSCI Emerging Markets Index.
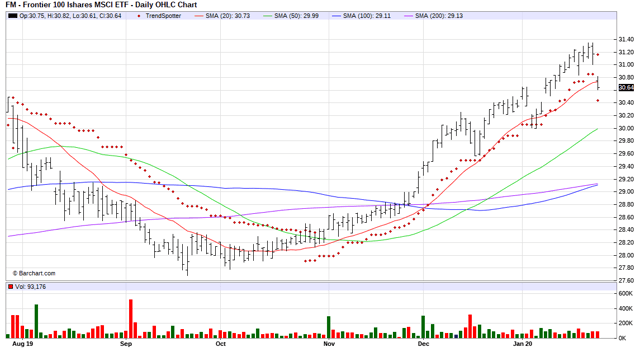
The iShares MSCI Frontier 100 ETF seeks to track the investment results of an index composed of frontier market equities. The ETF seeks investment results that correspond generally to the price and yield performance of the MSCI Frontier Markets 100 Index.
As you can see EEM dropped much more that the FM.
(Click on image to enlarge)
(Click on image to enlarge)
Barchart's Opinion Trading systems are listed below. Please note that the Barchart Opinion indicators are updated live during the session every 10 minutes and can, therefore, change during the day as the market fluctuates. The indicator numbers shown below, therefore, may not match what you see live on the Barchart.com website when you read this report.
Barchart technical indicators:
- 56% technical buy signals
- 1.18+ Weighted Alpha
- 2.04% gain in the last year
- Trend Spotter sell signal
- Although it closed above its 100 day moving average, it dipped below its 20, 50 and 100 day moving averages
- 35.16% Relative Strength Index
- Closed at 43.06 which was below its support level at 44.32
Fundamental factors:
- Market Cap $31.01 billion
- P/E 12.77
- Dividend yield 2.78%
Disclosure: None.


