
Earnings Momentum Trumps Overblown Worries About Inflation And Valuations
Stocks are once again challenging all-time highs as the forward earnings estimates are being raised at a historically high rate in the wake of another impressive earnings season that blew away all consensus expectations. YTD through May, index total returns were strong across the board, including +12.7% for S&P 500, +6.6% for Nasdaq 100 (as mega-cap growth endured the brunt of the Value rotation), and +15.2% for Russell 2000 small caps. The strong earnings reports have given rise to further upgrades to forward sales and earnings from a highly cautious analyst community, many of whom are still concerned about COVID variants, supply chains, inflation, and Fed tapering, among many other worries.
Nevertheless, prices have not gone up as fast as earnings, so valuations have receded a bit, with the S&P 500 falling from a forward P/E of 21.8x at the start of the year to 21.2x at the end of May (i.e., -2.8% versus a total return of +12.7%). Cyclicals in particular have seen this same trend since they were largely bid up on speculation. For example, Energy (XLE) is up +39.2% YTD, but its forward P/E has fallen from 29.2x to 17.2x (-28.4%). With plenty of cash on the sidelines, many investors likely are holding back and hoping for a solid pullback rather than deploy cash at what may still appear to be elevated valuations and stretched technicals, as they move past a speculative investing mindset and into a more fundamentals and quality-oriented stage. While more speculative asset classes like SPACs and cryptocurrencies already have endured a pretty severe correction (driven by negative press or tweets from influential personalities), stocks really haven’t yet seen a healthy cleansing.
When the April YOY CPI reading came out on 5/12 at a surprisingly high +4.2%, stocks were expected to selloff hard, led by mega-cap growth stocks. But instead, they quickly gathered conviction and resumed their march higher. Small-cap value (which is dominated by cyclical sectors like Financial, Industrial, Materials, and Consumer Discretionary) in particular remains quite strong this year as the Value rotation continues in the face of an expansionary/recovery economic phase, unabated government support and largesse, and a continued productivity boom. And with GDP growth accelerating, particularly as the economy fully reopens and hobbled global supply chains are mended or rerouted, it is likely that the Street’s forward earnings estimates (even after the recent upgrades) are still too low, which means stocks should have more room to run without relying upon multiple expansion, in my view.
So, two questions seem to linger on everyone’s mind: 1) how might inflationary pressures impact economic growth and the stock market, and 2) are stock valuations overdone and at risk of a major correction? I tackle these questions in today’s post. In short, I believe earnings momentum should win out over overblown inflation worries and multiple contraction as we embark upon a multi-year boom (a “Roaring ‘20s” redux?) – but not without bouts of volatility.
With no clear path for runaway inflation and given the recent rotation out of the Growth factor, investors now seem to be adding exposure to both secular and cyclical growth – which is what my regular readers know I have been suggesting and what Sabrient’s GARP portfolios (including our flagship Baker’s Dozen) reflect.
In this periodic update, I provide a comprehensive market commentary, offer my technical analysis of the S&P 500 chart, review Sabrient’s latest fundamentals-based SectorCast quant rankings of the ten US business sectors, and serve up some actionable ETF trading ideas. To summarize, our sector rankings reflect a solidly bullish bias, the technical picture is still long-term bullish (although in need of further near-term consolidation), and our sector rotation model retains its bullish posture.
Commentary:
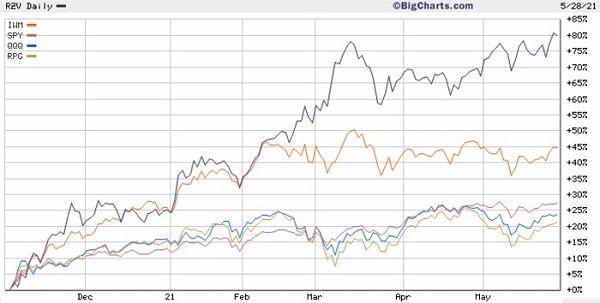
The chart below illustrates various performance differentials since the value rotation began on 11/1/2020 by comparing Invesco S&P SmallCap 600 Pure Value (RZV), iShares Russell 2000 (IWM), SPDR S&P 500 Trust (SPY), Invesco Nasdaq 100 (QQQ), and Invesco S&P 500 Pure Growth (RPG). You can see that the growth and large-cap-oriented SPY, QQQ, and RPG continue to be bunched together at the bottom. However, since mid-February, the broader small-cap index (IWM) has essentially gone sideways while small-cap value continues to surge higher. According to S&P Dow Jones Indices, most style factors posted gains during May, led by High Beta and most Value-oriented strategies, while Growth and Momentum both declined. Most sectors posted gains, led by Energy. The CBOE Volatility Index (VIX) closed the month at a relatively complacent 16.76 after spiking mid-month to nearly 29 following the latest CPI reading.
At the height of the pandemic, businesses conserved cash by slashing spending on Capex and R&D, as well as dividends, buybacks, and M&A. Moreover, they leveraged the ultra-low interest rates to raise cheap capital and bolster liquidity. Aggregate corporate cash surpassed $2.1 trillion, up more than 30% from the end of 2019. Fast forward to today, we see surging GDP growth and business confidence, as well as soaring revenues, earnings, and profitability.
The Commerce Department’s BEA announced on 5/28 its second estimate for Q1 2021 GDP growth at an annual rate of 6.4% (unchanged from preliminary estimate, and up from 4.3% for Q4 2020), which would be the largest growth rate since 1984 (next update will be 6/24). Moreover, Q1 ended with the month of March showing incredible surges in household income (21.1%, the highest reading ever recorded), personal savings (27.6%), and consumer spending (8.1%). Looking ahead, the Atlanta Fed’s GDPNow model is forecasting Q2 2021 GDP will show a robust annual growth rate of 10.3% (as of 6/1, with next update coming on 6/8) on the backs of strong consumer spending, a manufacturing backlog, and inventory build.
On the other hand, a swelling US current-account deficit has many fretting about a weakening dollar and perhaps its imminent demise as the world’s reserve currency. The median economist estimate expects the current-account deficit to hit 3.6% of GDP this year, which would be the largest since 2008. Some experts think the dollar is too expensive such that non-US assets are increasingly attractive, causing capital to rotate out of US fixed-income and equity markets. However, in my view, the huge gap between imports and exports was driven by US money-printing bolstering consumer demand while manufacturing activity was slowed or shut down.
Moreover, a robust US economy and rising imports do not necessarily lead to dollar weakness mainly because our capital account continues to show a huge surplus, as foreign investors crave access to the innovation and disruption of US companies, particularly in the Tech sector. Yes, the US is printing dollars (and monetizing debt) at a ridiculous rate, but other major economies are doing so as well, and the US is always looked upon as a global safe haven in times of uncertainty (which includes today’s unprecedented circumstances).
Of course, China has become a formidable rival for economic, technological, and military hegemony. But China is highly indebted and leveraged like everyone else and desperately needs global capital inflows. And as long as the yuan is pegged to the dollar, with only the US able to print such vast sums of money at will without stoking massive inflation, China won’t be able to catch up to our per capita GDP.
The dollar being the world’s reserve currency is what allows us to maintain global hegemony – but it also emboldens our leaders to engage in unfettered money-printing to fund various bailouts and boondoggles. So, if today’s de facto implementation of Modern Monetary Theory (MMT) induces no inflation, there is theoretically no limit to what our government might try to do, including forgiving college loans, bailing out municipal pension liabilities and state budget shortfalls, or even providing reparations for any person or group who feels wronged by historical slights, cruelty, misfortune, misguided leadership, or their own poor choices.
It is an uncomfortable situation to behold for any financially responsible person, and as a result, investors seem to be hedging their bets with increased allocations to gold. Gold had been sort of treading water far longer than most commentators had predicted. But then last month brought about a solid technical breakout above all key moving averages. As renewed physical demand in China and India combines with continued investor demand, some think that record highs may be on the way, with predictions of perhaps $2,500 by the end of 2022.
Inflation may not be what it seems
“Don’t fight the fed” remains the key adage to live by, and the bond market certainly is not as investors (alongside the Fed itself) continue to buy what the US Treasury issues. Moreover, investors appear to believe the Fed has their backs in pursuing higher yields. Investment grade and high yield corporate bond spreads remain quite low (91 and 334 basis points over Treasuries, respectively, as of 5/31), which are at or near pre-pandemic lows. Importantly, the BBB US corporate bond spread (historically an indicator of market risk perception) is quite tight at only 113 bps.
The +4.2% headline CPI reading on 5/12 (and +3.0% core) spooked markets and spiked volatility – and made many cable news commentators hyperventilate – but it was misleading. As DataTrek pointed out, used car and gasoline prices together produced well over half (235 bps) of the headline number. Used car and truck prices rose due to chip shortages that limited supplies of new cars, and gasoline spiked YOY only because of low comps from zero demand during the depths of the lockdowns (i.e., low base period), which forced shut-in oil production that is slow to restart. In fact, if you ignore the brief pandemic dip one year ago and instead overlay a smoothed hypothetical CPI trendline during that timeframe, the headline number would have been more like 2.9% YOY inflation instead of 4.2%.
As fears about rampant price inflation following that big CPI print have moderated and the 10-year Treasury yield hovers around the 1.6% level, it appears that the spike in many input prices was mainly driven by constraints on production capacity due to disrupted supply chains and the flipside of cost-efficient Just In Time manufacturing (and lean inventories) and couldn’t come back onstream fast enough to meet a sudden spike in demand. No doubt, we are seeing asset inflation given the currency printing presses at full speed, and investable assets can’t grow as fast as the printing press can run. But when it comes to rising consumer demand, supply can indeed catch up as supply chains and manufacturing are resurrected and labor shortages are resolved. Moreover, there are many disinflationary structural factors at work like aging demographics, slowing global population growth, re-globalization of trade and supply chains, and of course the rapid pace of development of new innovative/disruptive technologies that improve productivity in ways that are hard to fully foresee.
Thus, I continue to doubt we are on the verge of an inflationary surge (leading to “stagflation”) – that is, assuming some level of congressional gridlock serves to restore a little post-pandemic fiscal restraint and prevent the federal government from taking control of all aspects of our lives, rewriting the Constitution, and curtailing states’ rights. It appears the Fed is maintaining its “transitory” view of inflation and is more willing to err toward accommodation rather than be too quick to tighten. Historically, the Phillips Curve suggested that inflation and unemployment have an inverse relationship. But that relationship has been all but deemed permanently broken by the trend of persistently low inflation over the last 30 years even as unemployment hit record lows, thus convincing the Fed that both low inflation and low unemployment are attainable.
Supporting this “transitory” inflation theme, TIPS implied inflation rates remain subdued. Although CPI printed 4.2%, TIPS are showing 5-year breakeven inflation at only 2.6% while 5-year, 5-year forward inflation is forecasting 2.3%. According to Deutschland bank, we have seen the heaviest flows into the TIPS market since 2010.
Moreover, according to Carl Weinberg of High-Frequency Economics, we are a long way from getting “the labor markets in developed economies to the point where the employment objectives of all the central banks are going to be met by enough of a margin that they will consider withdrawing monetary support.” He thinks that by year-end base effects will have passed and one-time factors like the rise in oil prices and the global chip shortage (both due to supply shocks) will “resolve themselves through normal market mechanisms.”
As I discussed last time, the velocity of M2 money stock remains near a record low (currently around 1.12), indicating little multiplier effect on the money being injected into the economy and thus little inflationary impact. In addition, there are still many disinflationary factors in play like aging demographics, slowing global population growth, re-globalization of trade and supply chains, and technological disruption/innovation in science, technology, and medicine that create prosperity while offsetting inflationary drivers by improving productivity and efficiency.
Similarly, Cathie Wood of ARK Invest got a lot of press recently with her interesting opinions on the path of inflation. She thinks the greater risk is deflation – from innovation/disruption like I described above as well as the “creative destruction” of companies that chose to buy back shares rather than innovate and modernize. She thinks commodity prices have spiked due to rapid rebuilding of inventories, so unwinding those inventories will actually cause prices to fall.
Certainly, this would be good news for China, whose growth depends upon affordable raw materials, commodities, and food. So, while the US Fed is trying to stoke inflation, China has been making policy moves to control commodity prices. Nevertheless, I think a nascent commodity “Supercycle” is still likely, albeit slower and more gradual for the longer term than many observers have predicted – which was mostly their knee-jerk reaction to the price spike in construction materials (like lumber and copper) caused by a combination of surging demand and supply chain disruptions (plus some ransomware attacks, to boot). Perhaps this more temperate view of inflation is why Chinese stocks have been catching a bid lately.
Powerful earnings momentum justifies valuations
As I said in my prior post, after a big speculative recovery rally characterized by multiple expansion rather than earnings growth, investors are now looking for stocks to justify their elevated valuations with actual earnings growth (as well as solid earnings quality). In fact, earnings had to come in much better than expected, as forward valuation multiples stabilize and even recede a bit. Thankfully, Q1 was the best quarter in several years, as about 87% of the S&P 500 companies beat expectations with an aggregate YOY EPS growth rate of 52% (albeit against easy comps in Q1 2020) and 76% beat revenue estimates. In other words, earnings are rising to meet prices rather than prices falling to meet earnings.
Assuming aggregate S&P 500 earnings of $192/share for full-year 2021 and $220/share in 2022 along with a current index level around 4,200, the full-year 2021 P/E is about 21.9x and the 2022 P/E is 19.1x. Thus, if stocks are going to have more upside potential without multiple expansion, earnings for the rest of 2021 and 2022 will need to be even better than the Street’s forecasts, which I think is a good bet. Because analysts still seem reluctant to go too far out on a limb, I think earnings indeed will continue to beat expectations – so long as there is no sudden resurgence in the pandemic here at home or a sustained surge in inflation that causes the Fed to tighten. But again, I think those scenarios are unlikely. That’s not to say there aren’t hurdles ahead – not the least of which is the surge in cases of a highly contagious COVID strain in key manufacturing countries like India and Vietnam. But even so, I think earnings expectations are understated.
Final comments
In my view, it was normal to see record low-interest rates last summer given the economic shutdowns, and as the economy reopens, interest rates are simply returning to pre-pandemic levels. Furthermore, relatively higher yields in the US attract global capital. At the same time, the Fed continues to pledge its support – indeed, I think it may even implement yield curve control (YCC) to help keep longer-term rates in check.
In its response to the Financial Crisis, Fed policy primarily served to recapitalize banks rather than boost the economy such that value stocks struggled while less capital- or labor-intensive growth companies thrived (due to an ability to maximize productivity in a so-called "jobless recovery”). In contrast, the Fed’s response to the pandemic was targeted specifically at boosting economic activity since banks were already healthy, which has been favorable for value stocks and cyclical sectors.
And as for inflation, although the headline CPI reading of 4.2% sounds ominous, much of it can be explained away as temporary. And with so many early-cycle tailwinds, including Fed support, low-interest rates, record levels of business and CEO confidence, strong earnings momentum, rising productivity and profitability, and robust consumer spending, stocks appear to have plenty of runway.
Thus, I continue to believe the best course of action is to remain bullish and invested in both cyclical and secular growth equities. Given that many of the big momentum Tech stocks that prospered from WFH and other pandemic impacts have pulled back, some of them are displaying attractive valuations once again. Regardless, I expect fundamental active selection, strategic beta, and equal weighting will continue to outperform the cap-weighted passive indexes that have been so hard to beat over the past few years. This should be favorable for Sabrient’s enhanced growth-at-a-reasonable-price (aka GARP) approach, which combines value, growth, and quality factors while striking a balance between secular growth and cyclical/value stocks and across market caps.
SPY Chart Review
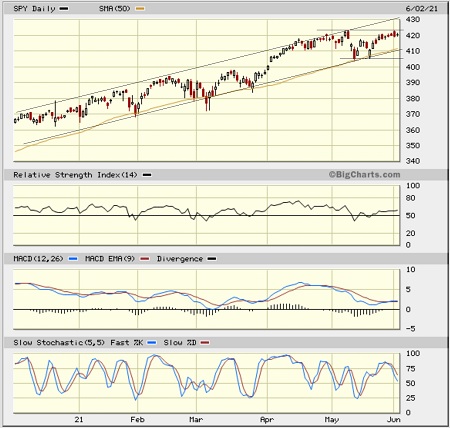
The SPDR S&P500 Trust (SPY) closed Wednesday 6/1/2021 at 420.33. Looking at the 6-month daily chart below, SPY is challenging all-time highs and trying to avoid forming a bearish double-top in a 1-month sideways channel. The longer-term rising channel (from the start of the Value rotation on 11/1/2020) remains intact, and the current price action falls right in the middle of it. Oscillators RSI, MACD, and Slow Stochastics are all in neutral positions and could go either way from here. The bottom of the long-term rising channel has coincided with the 50-day simple moving average (SMA) in providing reliable support this year. Other support levels include bullish price gaps at 410 and 400 and the bottom of the sideways channel around 405.
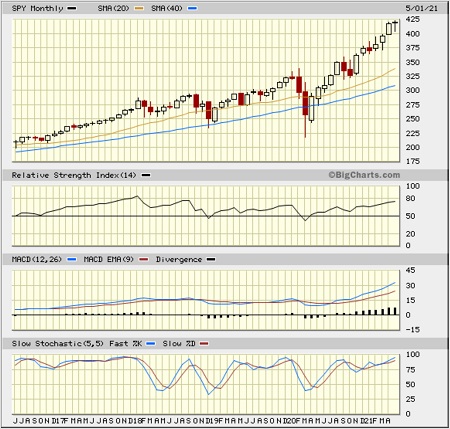
Looking at the monthly chart below, it is quite a bit more ominous, with price quite extended above the 20-day (and all other) moving average. The month of May formed something close to a hanging man candlestick, which is quite bearish. Typically, the greater the divergence from moving averages, the greater the correction. However, it is possible that price could simply consolidate during the summer while waiting for the moving averages to catch up. I suggest being vigilant about a potential correction – although I believe it would be a great buying opportunity.
Latest Sector Rankings
Relative sector rankings are based on our proprietary SectorCast model, which builds a composite profile of each of over 900 equity ETFs based on bottom-up aggregate scoring of the constituent stocks. The Outlook Score employs a forward-looking, fundamentals-based multifactor algorithm considering forward valuation, historical and projected earnings growth, the dynamics of Wall Street analysts’ consensus earnings estimates and recent revisions (up or down), quality, and sustainability of reported earnings, and various return ratios. It helps us predict relative performance over the next 2-6 months.
In addition, SectorCast computes a Bull Score and Bear Score for each ETF based on the recent price behavior of the constituent stocks on, particularly strong and weak market days. A high Bull score indicates that stocks within the ETF recently have tended toward relative outperformance when the market is strong, while a high Bear score indicates that stocks within the ETF have tended to hold up relatively well (i.e., safe havens) when the market is weak.
Outlook score is forward-looking while Bull and Bear are backward-looking. As a group, these three scores can be helpful for positioning a portfolio for a given set of anticipated market conditions. Of course, each ETF holds a unique portfolio of stocks and position weights, so the sectors represented will score differently depending upon which set of ETFs is used. We use the iShares that represent the ten major U.S. business sectors: Financial (IYF), Technology (IYW), Industrial (IYJ), Healthcare (IYH), Consumer Goods (IYK), Consumer Services (IYC), Energy (IYE), Basic Materials (IYM), Telecommunications (IYZ), and Utilities (IDU). Whereas the Select Sector SPDRs only contain stocks from the S&P 500 large-cap index, I prefer the iShares for their larger universe and broader diversity.
Here are some of my observations on this week’s scores:
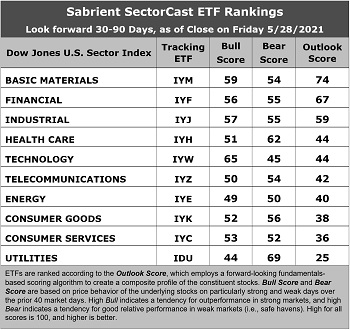
1.Basic Materials takes the top spot with an Outlook score of 74, given strong analyst sentiment (recent positive net revisions to EPS estimates), a reasonable forward P/E of 18.0x, and an attractive forward PEG (forward P/E divided by projected EPS growth rate) of 1.65. Financial falls to second with an Outlook score of 67, with a reasonable forward P/E of 18.4x, and an attractive forward PEG of 1.41. Industrial is in third and notably displays the best analyst sentiment and insider sentiment (open market buying). Rounding out the top seven are Healthcare, Technology, Telecom, and Energy, which is quite bullish. Notably, Energy continues to rise, with a falling forward P/E (now at 17.1x) as oil approaches $70.
2.At the bottom are Utilities and Consumer Services (Discretionary/Cyclical) with Outlook scores of 25 and 36, respectively. Utilities is in the cellar primarily due to having little in the way of upward earnings revisions (although all 10 sectors have positive revisions), a low projected EPS growth rate of 6.0%, and by far the highest forward PEG of 3.14.
3.Looking at the Bull scores, Technology displays the top score of 65, followed by Basic Materials at 59, as stocks within these sectors have displayed relative strength on strong market days. Utilities scores the lowest at 44. The top-bottom spread of 21 points reflects low sector correlations on strong market days. It is desirable in a healthy market to see low correlations reflected in a top-bottom spread of at least 20 points, which indicates that investors have clear preferences in the market segments and stocks they want to hold.
4.Looking at the Bear scores, defensive sector Utilities scores the highest at 69, followed by Healthcare at 62, as stocks within these sectors have been the preferred safe havens lately on weak market days. Technology displays by far the lowest score of 45, as investors have fled during recent market weakness. The top-bottom spread of 24 points reflects low sector correlations on weak market days. Ideally, certain sectors will hold up relatively well while others are selling off (rather than broad risk-off behavior), so it is desirable in a healthy market to see low correlations reflected in a top-bottom spread of at least 20 points.
5.Basic Materials displays the best all-around combination of Outlook/Bull/Bear scores, while Utilities is the worst. Looking at just the Bull/Bear combination, Basic Materials, Healthcare, and Utilities share the highest score (quite a mixed bag), indicating superior relative performance (on average) in extreme market conditions whether bullish or bearish, while Energy scores the worst.
6.This week’s fundamentals-based Outlook rankings display a solidly bullish bias, given that the top 5 (and 6 of the top 7) sectors are economically-sensitive or all-weather. The near-term earnings outlook in our fundamentals-based model is displaying much clearer visibility as the economic reopening accelerates. Keep in mind, the Outlook Rank does not include timing, momentum, or relative strength factors, but rather reflects the consensus fundamental expectations at a given point in time for individual stocks, aggregated by sector.
ETF Trading Ideas
Our Sector Rotation model, which appropriately weights Outlook, Bull, and Bear scores in accordance with the overall market’s prevailing trend (bullish, neutral, or defensive), continues to display a bullish bias and suggests holding Technology (IYW), Basic Materials (IYM), and Financial (IYF), in that order. (Note: In this model, we consider the bias to be bullish from a rules-based trend-following standpoint when SPY is above both its 50-day and 200-day simple moving averages.)
If you prefer a neutral bias, the Sector Rotation model suggests holding Basic Materials, Financial, and Industrial, in that order. Or, if you are more comfortable with a defensive stance, the model suggests holding Utilities, Healthcare, and Basic Materials, in that order.
An assortment of other interesting ETFs that are scoring well in our latest rankings include iShares US Home Construction (ITB), AdvisorShares Dorsey Wright ADR (AADR), First Trust Indxx Global Natural Resources Income (FTRI), First Trust Financials AlphaDEX (FXO), First Trust Rising Dividend Achievers (RDVY), Vanguard US Value Factor (VFVA), VanEck Vectors Steel (SLX), Invesco S&P SmallCap Value with Momentum (XSVM), Invesco Dynamic Market (PWC), Principal Value (PY), Hoya Capital Housing (HOMZ), VanEck Vectors Semiconductor (SMH), Global X MLP (MLPA), WBI BullBear Quality 3000 (WBIL), Invesco DWA Basic Materials Momentum (PYZ), and First Trust NASDAQ ABA Community Bank Index (QABA), among many others.
Disclosure: At the time of this writing, among the securities mentioned, the author held protective puts in SPY.
Disclaimer: This newsletter is published solely for informational purposes and is ...
more

