
Ducks Continue To Line Up Positively For Equities
The market this year has been oscillating between fear and optimism, risk-off and risk-on. Until 8/27/19, risk-off defensive sentiment was winning, but since that date a risk-on sentiment has taken hold, and the historic divergence favoring secular growth, low-volatility and momentum factors, defensive sectors, and large caps (i.e., late-stage economic cycle behavior) over cyclical growth, value and high-beta factors, cyclical sectors, and small-mid caps (i.e., expansionary cycle behavior) continues to reverse, as fickle investors have become optimistic about at least a partial resolution to the trade war (including the lifting of tariffs), an improving outlook for 2020-21 corporate earnings, and resurgent capital investment. Investors have moved from displaying tepid and fleeting signs of a risk-on rotation to full-blown bullish enthusiasm and reluctance to sell in a fear of missing out (FOMO), even though the short-term technical picture has become overbought.
The late-August risk-on rotation came in the nick of time. Last year at that same time of the year, the S&P 500 was marching higher until peaking on 9/20/18, but it was doing so on the backs of defensive sectors along with secular-growth Tech mega-caps, and I was opining at the time that the rally would fizzle if there wasn’t some rotation into the risk-on cyclicals and small-mid caps – which as you know didn’t happen, leading to the Q4 selloff. But, happily, this year has played out quite differently.
Nevertheless, a lot of successful fundamentals-based strategies (including powerhouse quant firm AQR Capital, discussed below) really took it on the chin for the roughly 14-18 months preceding 8/27, ostensibly due to fear that a “late-cycle” economy was on the verge of recession. And indeed it was becoming a self-fulfilling prophesy, as the dominos seemed to be falling one by one: escalating trade wars creating uncertainty leading to a global manufacturing slowdown, a hold-off in corporate capital spending, and negative interest rates overseas, which pushed global capital into US debt, which temporarily inverted the yield curve, which brought out the doomsaying pundits – all of which was beginning to negatively impact the previously-bulletproof consumer sentiment that had been carrying US GDP growth.
But it was all based on false pretenses, in my view, and investors now seem to be convinced that the bottom is in for the industrial cycle and the corporate earnings recession, and particularly for prices of value/cyclical stocks with solid fundamentals. Results haven’t been as bad as feared, and some of the macro clouds are parting. Ultimately, stock prices are driven by earnings expectations and interest rates (for discounted cash flow valuation), and as the external obstacles hindering the free market are lessened or removed, the outlook brightens. And when investors focus on the fundamentals rather than the latest tweet, CNN headline, or single economic number taken out of context, it bodes well for Sabrient’s value-tilted GARP (growth at a reasonable price) portfolios, which of course includes our flagship Baker’s Dozen.
In this periodic update, I provide a detailed market commentary, offer my technical analysis of the S&P 500, review Sabrient’s latest fundamentals-based SectorCast rankings of the ten US business sectors, and serve up some actionable ETF trading ideas. In summary, our sector rankings still look neutral to me, while the longer-term technical picture remains bullish, and our sector rotation model retains a solidly bullish posture.
Market Commentary:
Capital is rotating out of bonds and into equities. Institutional demand (the “smart money”) has surged. And the rally has been broad-based, as the Invesco S&P 500 Equal Weight (RSP) has been slightly outperforming the cap-weighted SPDR S&P 500 (SPY), while the Invesco S&P SmallCap 600 Equal Weight (EWSC) is outperforming the cap-weighted SPDR S&P SmallCap 600 (SLY) as well as both the SPY and RSP. But performing better than all of them is the SPDR S&P 600 Value (SLYV), which is quite bullish. So, it isn’t just Technology attracting capital.
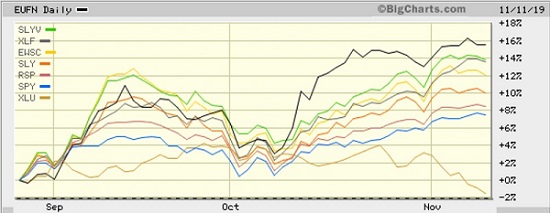
Prior to 8/27, year-to-date sector leadership comprised Utilities, Consumer Staples, and Real Estate, but since then, laggards like Materials, Financials, Industrials, and Transports have become the leaders. Even Healthcare, which has been struggling under the weight of political rhetoric (e.g., “Medicare for All” and drug pricing) has been making a comeback. Banks, homebuilders, building supply, oil refining, trucking, and semiconductors have been leaders, and “deep cyclicals” like steel, mining, chemicals, railroads, heavy equipment, and machinery companies are attracting capital, as well – which is not suggestive of an impending recession. And on the chart below, take a look at the iShares MSCI Europe Financials (EUFN), which is up nearly +16% since 8/27. It also shows outperformance in Financial Select Sector SPDR (XLF) and the aforementioned SLYV, EWSC, and SLY versus RSP, SPY, and (defensive) Utilities Select Sector SPDR (XLU).
(Click on image to enlarge)
But as you might expect, Tech (except for the software segment) is not being left behind. In particular, the cyclical semiconductor industry is trading at new all-time highs, reflecting the secular growth expectations of 5G, AI, Internet of Things, Big Data, robotics, autonomous vehicles, augmented reality (AR), etc. Only the Energy sector (except for the consumer-oriented refining & marketing segment, which is looking strong) continues to struggle among the cyclical sectors.
My friends at DataTrek observed a few weeks ago (on 10/22) that while the S&P 500 was handily outperforming the Russell 2000 this year, it was completely attributable to secular growth “large-cap disruptive technology,” and primarily driven by six mega-caps: Apple (AAPL), Microsoft (MSFT), Visa (V), Mastercard (MA), and Oracle (ORCL) – which make up 50% of the Technology sector by market cap – plus Facebook (FB), which is now in the Communications Services sector. Without these juggernauts, DataTrek determined that the S&P 500 actually would be lagging the Russell 2000 small caps. Moreover, this handful of mega-caps was suppressing overall market volatility, whereas the vast majority of stocks actually have been much more volatile. Of course, “deep cyclicals” like Industrials, Energy, and Materials have been heavily impacted by the unending trade war, and the small-cap universe is dominated by value/cyclical sectors like Financials and Industrials that have been buffeted by uncertainty, in contrast to the large-cap universe that is dominated by secular growth Technology (which by the way, makes the S&P 500 a difficult benchmark to compete within anomalous times like these).
FactSet observed last Friday that, after 89% of S&P 500 companies have reported Q3 results, aggregate year-over-year earnings are showing a decline of -2.4%, which marks the first time the index has reported three straight quarters of year-over-year declines in earnings since 4Q2015-2Q2016. Moreover, net profit margin for the S&P 500 appears to be around 11.3%, which would mark the first time the index has reported three straight quarters of year-over-year declines in net profit margin since 2009. It all seems to be driven by difficult year-over-year comparisons (which were historically high last year, including record profitability of 12%) as well as higher costs like wages and raw materials. The latest BLS data showed productivity declined 0.3% last quarter while unit labor costs rose 3.6% over last year. But make no mistake, this is still solid profitability. Note that many corporations warned of lower earnings and profitability due to the difficult comps versus last year’s sudden boost from the tax cuts. So, investors were expecting this and are now focused on the horizon ahead, with earnings and profitability expected to increase (and benefit from this year’s lower comps). Indeed, that will have to be the reality if stocks are to continue to rise since further multiple expansion is unlikely, especially given the gradual steepening of the yield curve (which increases the discount rate on future earnings).
Of note, UBS lead strategist Francois Trahan wrote a gloomy update to clients, saying, “Every bear market of the past 50 years has witnessed an actual decline in S&P 500 forward earnings…Ultimately, the most vulnerable macro backdrop for equities occurs when forward earnings growth turns negative as LEIs are trending downward (pushing P/E lower)”. True enough. But here’s the rub from my perspective. The underlying weakness in manufacturing and incorporate capital spending has been driven by uncertainty from the escalating trade war, not from overproduction, rising inflation, or central bank tightening. Already, investors are anticipating a positive turn in the trade war, particularly given the urgency created by both economic weakness in China and the impending US election – and given that the prevailing view is that there is little likelihood of the Senate removing Trump from office, a resurgent economy and rising corporate earnings in 2020-21 seems more and more likely to investors.
IHS Markit’s latest report on manufacturing and service-sector activity showed overall output in the economy during October hit a 3-month high while manufacturing activity alone hit a 6-month high – as compared to September’s manufacturing reading that was the worst since the financial crisis. The firm observed, “…we are now seeing some signs of manufacturing pulling out of its downturn, in part driven by a return to growth for exports and improved sentiment about the year ahead, linked to hopes that trade war tensions are starting to ease.”
I won’t go into detail on the latest jobs report, which was quite impressive. But to me, the main implication of the low unemployment rate, upward revisions to prior months, and strong internals (like record-low unemployment among minorities and lower-educated workers) is that it is indicative of an expansionary phase, with no recession in sight, especially when you also consider that businesses have been holding back on capital spending until they have greater visibility vis-à-vis the trade war. One can only imagine the kind of boost we might see from resurgent capital investment.
GDP and Interest rates:
As for US GDP, following Q1 growth of +3.1% and Q2 growth of +2.0%, the BEA’s advance estimate for Q3 2019 is 1.9%. Looking ahead to Q4 estimates, the Atlanta Fed’s GDPNow model predicts +1.0% GDP growth (as of 11/8) and the NY Fed’s NowCast sees +0.7% (as of 11/8), while the St. Louis Fed NowCast sees a more optimistic +1.9% (as of 11/8). Looking globally, the IMF’s October World Economic Outlook shows world GDP growth slowing from 3.6% in 2018 to 3.0% in 2019 but then rising to 3.4% in 2020. If this year indeed ends up at 3.0%, it would be the slowest global growth since the financial crisis. According to the IMF, trade barriers and rising geopolitical tensions are disrupting global supply chains and hindering investment. Meanwhile, the OECD’s September Interim Economic Outlook downgraded its 2019 forecast, projecting world GDP to grow by 2.9% in 2019 and 3.0% in 2020, with most of the weakness due to disrupted global trade hurting the largest economies.
As expected, the Fed cut the fed funds rate by another 25 bps at its late-October meeting (to a target range of 1.50-1.75%), which was its third straight cut. Some Fed governors have likened these cuts to the so-called “insurance cuts” in 1995-6, which similarly comprised three rate cuts following a short-lived tightening cycle in the middle of an economic expansion (ultimately running another four years until the “Internet Bubble” burst). Chair Jay Powell said during his press conference, “The U.S. economy is in its 11th year of expansion, and the baseline outlook remains favorable... Household spending continues to be strong, supported by a healthy job market, rising incomes, and solid consumer confidence.” And despite extreme weakness in business investment, there is strength in residential investment (i.e., housing), boosted by low mortgage rates. Powell further explained, “…monetary policy is also supporting household spending and home buying by keeping the labor market strong, keeping workers’ incomes rising, and keeping consumer confidence at high levels.”
But low inflation (as measured by the Fed’s preferred core PCE, which fell to 1.7% in September) seems to remain troubling to Mr. Powell, which means that although the Fed may not be eager to cut rates any further, they are unlikely to raise rates anytime soon, either. In fact, Powell indicated as much in the policy statement by replacing their previous phrase of "act as appropriate" to sustain the economic expansion with "continue to monitor the implications of upcoming information for the economic outlook." Perhaps the Fed has finally arrived at the elusive neutral rate.
However, some costs have been rising more than core PCE suggests, especially housing, autos, and education, so US household debt has been rising due to larger mortgages, auto loans, and student loans. But with lower interest rates comes lower debt burden and low default rates among consumers. Moreover, the credit spread for junk bonds has narrowed substantially, despite rising corporate debt levels, as investors are not as concerned about credit risks.
In any case, I think monetary policy has hit its limits of effectiveness. The main thing the US and global economies need right now is liquidity, which is abundant, so further rate cuts are likely to have little impact other than psychological. Indeed, as I have long opined, it seems that the Fed’s 10-year experiment with loose monetary policy (including ZIRP and QE) primarily served to prop up the economy by boosting investor psyches through asset inflation, which also worsened wealth inequality. Although I don’t agree with a lot of Ray Dalio’s latest macro insights, I agree with him when he said, “At the same time as money is essentially free for those who have money and creditworthiness, it is essentially unavailable to those who don’t have money and creditworthiness, which contributes to the rising wealth, opportunity, and political gaps.” In other words, it’s time for our legislative branch to stop its petulant infighting and step up with some new fiscal policies. In fact, the easy money often leads to misallocation of capital to questionable investments (like WeWork, for example). Let’s see some fiscal policies that support or encourage investment in important projects for our long-term economic health and national security, like the 5G infrastructure buildout, for instance.
As the Fed has cut on the short end, longer-term bond yields are rising and the yield curve continues to steepen as capital rotates out of Treasuries in search of higher-risk/higher-reward investments, and there is no inversion. This is all quite healthy. The 30-year Treasury yield closed last Friday at 2.43%, while the 10-year T-note closed at 1.94%, the 2-year T-note 1.68%, and the 3-month T-bill 1.55%. The 3-month/10-year spread is up to +39 bps, while the more closely followed 2-10 spread has risen to +26 bps. The US continues to pay much more lucrative yields compared with other developed markets, but rates are rising overseas, as well, although Germany, France, and Japan continue to “pay” negative rates on most of the shorter end of the curve (10 years and less).
Looking ahead to future Fed meetings, CME Group fed funds futures are showing only 5% probability of another 25-bp rate cut in December, rising to 14% in January. But by December 2020, there’s less than a 50% chance of another cut – and zero probability of a rate hike. Certainly, an interim trade deal (that removes tariffs and boosts Chinese purchases of US goods) and improving corporate earnings would be all the catalysts needed to boost corporate capital spending plans – which should entice a continued rotation of cash off the sidelines and out of fixed income and into attractive GARP and value stocks.
Style factors – a long overdue rotation back to value:
As BlackRock has expertly explained, “there are two main types of factors: macro factors, like economic growth, real rates and inflation, which explain the majority of the returns across many asset classes, and style factors, which allow us to select securities which potentially offer higher risk-adjusted returns within each asset class than the broad market. Style factors include value, quality, momentum, low size, and minimum volatility. Value & size typically outperform during the recovery phase of business cycle, momentum during the expansion phase, and quality & min vol during slowdown and contraction phases.” For much of the past 18 months – and in fact, intermittently over the past four years since the previous election campaign began in mid-2015 – worries about the end of the long expansion phase have infested the heads of investors despite solid forward outlooks issued by companies and the sell-side analyst community.
Cliff Asness of the quant-driven hedge fund AQR Capital recently published an in-depth study (as of 8/31/19) that concluded that the value factor had become out of favor and historically cheap. I too have written extensively over the past several months about this situation. Mr. Asness’ study observed that “pure value” has been underperforming growth for the 10 years since the financial crisis. But AQR’s model is not pure value, per se, but also includes, as he says, “…fundamental factors designed to pick up companies that are indeed worth or more than worth their valuations, or at least starting to get better (you can loosely think of this as trying to avoid ‘value traps’ though we believe they are positive average return factors on their own). They are generally trying to measure things like gross profitability, the short-term change in fundamental performance, the quality of accounting practices (looking for the dodgy versus upstanding companies), and piggybacking on the picks of ‘informed’ investors… So, these last 10 years have been a tale of woe for most well-known versions of the value factor. However, it has only been a tale of woe for AQR value for just over a year and a half…as the losses have been due to price moves, not fundamentals (and that’s when things cheapen).”
Similarly, Sabrient’s growth-at-a-reasonable-price (GARP) model also has strong value tilt, but much like AQR, it is not “pure value,” per se, also including several other fundamental factors related to earnings growth, profitability, quality, changes in sell-side consensus estimates, and accounting practices. And much like AQR, from the end of the financial crisis (March 2009) through February 2018, our portfolios performed quite well (despite a handful of drawdowns due to risk-off macro events) while most pure value strategies struggled. But for the recent 18-month period in Mr. Asness’ study (March 2018 through August 2019), unlike the prior eight years, he saw losses based more on what he considers to be irrational price moves rather than on changing fundamentals.
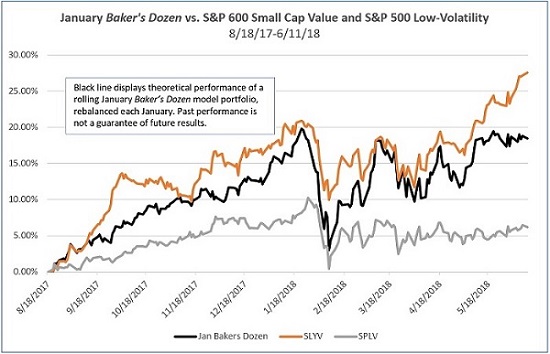
We feel his pain. But the good news is that the tide seems to be changing, with investors once again believing in the fundamental strength rather than worrying that everything would take a turn for the worse. Let’s start by looking at relative performance charts since mid-2017 when the run-up in anticipation of the tax reform bill commenced. The first chart below shows the correlation between the SPDR S&P 600 Small Cap Value ETF (SLYV) and a rolling January Baker’s Dozen model portfolio (theoretical gross performance, no fees), along with their outperformance versus the defensive Invesco S&P 500 Low Volatility ETF (SPLV) between 8/18/17 until the market began to bifurcate on 6/11/18.
(Click on image to enlarge)
I have written in many previous articles about the huge performance divergence that has been building since 6/11/18 (when the trade war escalated in a big way) between secular growth, low-volatility and momentum factors, bond-proxy defensive sectors, and large caps (i.e., late-stage economic cycle behavior) over cyclical growth, value and high-beta factors, cyclical sectors, and small-mid caps (i.e., expansionary cycle behavior). The latter tend to show leadership in a healthy economy and rising stock market. The chart below illustrates the very high correlation between the SPDR S&P 600 Small Cap Value ETF (SLYV) and a rolling January Baker’s Dozen model portfolio (theoretical gross performance, no fees), as well as the approximately -40 percentage points (pps) underperformance of those strategies versus the Invesco S&P 500 Low Volatility ETF (SPLV) between the start of the market bifurcation on 6/11/18 until the risk-on reversal day on 8/27/19. You can see the short-lived rally attempts following the Christmas Eve capitulation day.
(Click on image to enlarge)

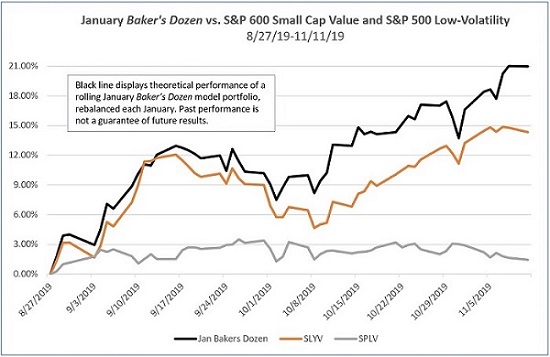
But ever since sentiment turned on 8/27/19, that massive performance divergence has been closing rapidly, with our theoretical rolling January Baker’s Dozen model portfolio significantly outperforming SPLV (as well as SLYV) through 11/11/19, as shown below.
(Click on image to enlarge)
Will this bullish rotation into value/cyclicals continue? According to JP Morgan’s quant strategist Marko Kolanovic, “We called for this rotation in July, and after an initial August setback, there was a multi-standard deviation rotation in September. Yet, there was broad skepticism at the time that the rotation was just a blip, so we reiterated that it had only begun and by far the largest part of the rotation was still ahead of us.”. I agree as I have been writing about the same divergence since summer 2018 when it was still in an early stage.
Nevertheless, we are always looking for ways to improve our process, so to further sidestep the dreaded “value trap” and cushion the downside a bit better when investor sentiment turns irrational, Sabrient founder David Brown and his team have been developing a new Growth Quality Rank (GQR) to introduce into our GARP model. In a nutshell, it helps us focus on those companies with consistent and reliable earnings growth, in addition to the magnitude of expected growth, relative valuation, corporate integrity, and earnings quality factors (among others) in which we have long focused.
Looking ahead:
While consumer sentiment remains quite strong, David Kostin of Goldman Sachs has pointed out that CEO sentiment is at the lowest levels since the financial crisis, so it comes as no surprise that they are holding back on financial commitments, whether capex, buybacks or dividend increases. But First Trust reports that real (inflation-adjusted) business investment is at 14.3% of real GDP, which is a higher share of real GDP than in any previous business cycle expansion. Furthermore, I think even an interim (“Phase 1”) resolution to the trade war would be expected to lift business confidence, open up the purse strings further, juice capex, reinforce jobs growth, and perpetuate the expansion. And once that dam breaks, given the large stores of cash and the ongoing enhanced cash flow from the tax savings, it could be quite stimulative to revenue and earnings growth, and ultimately to stock prices.
Indeed, investor optimism is growing as the yield curve steepens, with capital rotating out of pricey bonds into riskier assets (which in turn encourages further optimism). And with so much idle cash on hand including money market funds holding nearly $3.5 trillion in assets, and with hedge funds and individual investors still under-allocated to equities, there seems to be plenty of fuel to feed a continued rally. Notably, JP Morgan’s strategy team recently told its clients, “We maintain a significant and incrementally larger tilt in our model portfolio towards risky assets, based on signs of a cyclical recovery, easing geopolitical tensions, synchronized monetary easing, and defensive investor positioning across asset classes.” The firm suggests moving money from gold and Treasuries to risk-on assets like equities. Not to be outdone, BofA has stated that the traditional 60/40 stock/bond allocation is “no longer advisable,” and instead suggests adding more exposure to equities, particularly stocks with high dividend yields in underperforming (value-oriented) sectors like Financial, Industrial, and Materials.
Even bond guru Bill Gross is negative on bonds and recommends “high yielding, secure-dividend stocks.” Goldman’s David Kostin opined, “Positive equity market returns, rising interest rates, and stabilizing the U.S. and World GDP growth should support already-elevated equity exposures.” In addition, Denise Chisholm of Fidelity said that it’s “time to play offense” given that real interest rates in the US are negative, which historically is quite bullish, while both the ECB and Federal Reserve are cutting at the same time (which is rare but has always led to a stock market rally). And of course, First Trust’s Brian Wesbury has been consistently bullish for a long time.
So, I feel I’m in good company with my bullish outlook on US equities.
Final thoughts:
I’d like to make a brief observation about the ambush massacre in Mexico of those innocent American families by a drug cartel, just south of the Arizona border. Some pundits believe that Mexico is in danger of becoming a failed state – like Somalia, Sudan, Yemen, or Afghanistan where tribal warlords or armed gangs have the real power while the government serves as a mere figurehead. In Mexico, it is the drug kingpins who rule. My view for a long time has been that the casual recreational use of illicit drugs (mostly sourced through Mexico) among so many Americans – young and old, rich and poor, white-collar and blue-collar, across all races – has created this menace next door and filled its coffers with billions of dollars. This is not just a political or military problem; it’s a consumer demand problem. So, I implore US residents to simply stop and think about the carnage and lawlessness they are financially supporting every time they sit down to indulge in a quick high, and perhaps instead make the virtuous choice to starve the beast.
SPY Chart Review:
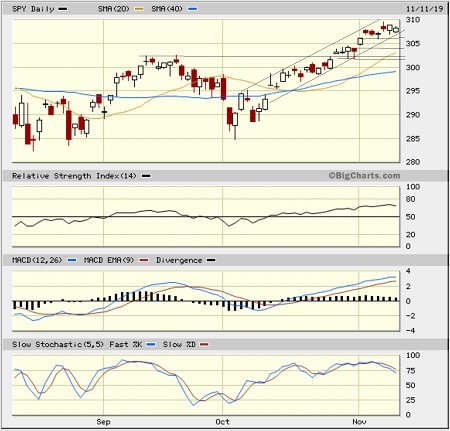
The SPDR S&P 500 ETF (SPY) closed Monday at 308.35 and has made a clean breakout to new all-time highs with leadership from risk-on market segments, as I believed it would. It is rising in a narrow uptrend channel, and investors seem reluctant to sell much at all for fear of missing out (FOMO), despite extremely overbought conditions. Oscillators RSI, MACD, and Slow Stochastics are all turning downward as at least some consolidation of the past four weeks of gains takes place. There are a few minor bullish gaps that might fill, around 306 and 304, and there’s the September high just below 303. All might be magnets to test support and bullish conviction. And the rapidly rising 20-day simple moving average might come into play, as well. But make no mistake, the technical picture is strong going into year-end.
(Click on image to enlarge)
Latest Sector Rankings:
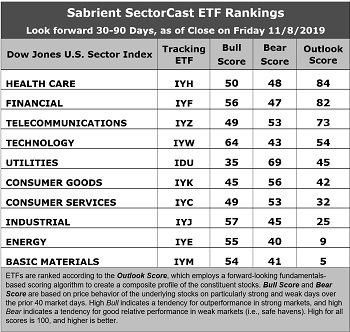
Relative sector rankings are based on our proprietary SectorCast model, which builds a composite profile of each of nearly 500 equity ETFs based on bottom-up aggregate scoring of the constituent stocks. The Outlook Score employs a forward-looking, fundamentals-based multifactor algorithm considering forward valuation, historical and projected earnings growth, the dynamics of Wall Street analysts’ consensus earnings estimates and recent revisions (up or down), quality and sustainability of reported earnings, and various return ratios. It helps us predict relative performance over the next 2-6 months.
In addition, SectorCast computes a Bull Score and Bear Score for each ETF based on recent price behavior of the constituent stocks on, particularly strong and weak market days. A high Bull score indicates that stocks within the ETF recently have tended toward relative outperformance when the market is strong, while a high Bear score indicates that stocks within the ETF have tended to hold up relatively well (i.e., safe havens) when the market is weak.
Outlook score is forward-looking while Bull and Bear are backward-looking. As a group, these three scores can be helpful for positioning a portfolio for a given set of anticipated market conditions. Of course, each ETF holds a unique portfolio of stocks and position weights, so the sectors represented will score differently depending upon which set of ETFs is used. We use the iShares that represent the ten major U.S. business sectors: Financial (IYF), Technology (IYW), Industrial (IYJ), Healthcare (IYH), Consumer Goods (IYK), Consumer Services (IYC), Energy (IYE), Basic Materials (IYM), Telecommunications (IYZ), and Utilities (IDU). Whereas the Select Sector SPDRs only contain stocks from the S&P 500 large-cap index, I prefer the iShares for their larger universe and broader diversity.
(Click on image to enlarge)
Here are some of my observations on this week’s scores:
1. There are some subtle shifts in the rankings this month. Healthcare has moved into the top spot with an Outlook score of 84, primarily due to an attractive forward P/E (16.0x) and the best sell-side analyst sentiment (net positive revisions to EPS estimates). IYH also displays a solid projected year-over-year EPS growth rate of 10.1%, the lowest (most attractive) forward PEG ratio (forward P/E divided by projected EPS growth rate) of 1.58, good return ratios, and the best insider sentiment (open market insider buying). Taking second once again is Financial with a score of 82, as it similarly displays reasonably good factor scores across the board, including a low P/E (16.3x) and an attractive forward PEG ratio of 1.72. Rounding out the top six are Telecom, Technology, Utilities, and Consumer Goods (Staples/Noncyclical). Notably, Technology displays the highest projected growth rate (13.2x) but also the highest forward P/E (21.7x).
2. At the bottom of the rankings, we find the three most highly cyclical sectors: Basic Materials, Energy, and Industrial, primarily because these sectors have seen by far the greatest net reductions to their earnings estimates from the sell-side analyst community.
3. Looking at the Bull scores, Technology enjoys the top score of 64, followed by Industrial at 57, as stocks within these sectors have displayed relative strength on strong market days. Defensive sector Utilities scores the lowest at 35. The top-bottom spread is a healthy 29 points, which reflects low sector correlations on strong market days. It is desirable in a healthy market to see low correlations reflected in a top-bottom spread of at least 20 points, which indicates that investors have clear preferences in the market segments and stocks they want to hold (rather than broad risk-on behavior).
4. Looking at the Bear scores, as usual, we find defensive sector Utilities alone in the top spot with a score of 69, followed by Consumer Goods at 56, which means that stocks within these sectors have been the preferred safe havens lately on weak market days. Energy has the lowest score of 40, followed by Materials at 41, as investors have fled during recent market weakness. The top-bottom spread is 29 points, which reflects very low sector correlations on weak market days. Ideally, certain sectors will hold up relatively well while others are selling off (rather than broad risk-off behavior), so it is desirable in a healthy market to see low correlations reflected in a top-bottom spread of at least 20 points.
5. Financial displays the best all-around combination of Outlook/Bull/Bear scores, followed by Healthcare, while Basic Materials is the worst. Looking at just the Bull/Bear combination, Technology is the best, followed by Utilities, indicating superior relative performance (on average) in extreme market conditions (whether bullish or bearish). Energy and Materials are tied for the worst.
6. I would say this week’s fundamentals-based Outlook rankings still reflect a neutral bias, given that the bottom of the rankings is populated by highly cyclical sectors Energy, Materials, and Industrial, but defensive sectors Utilities and Consumer Goods are stuck in the middle, while all-weather Healthcare and Telecom are highly ranked along with risk-on sectors Financial and Technology – so there’s no clear bias. It seems to me that perhaps the sell-side analyst community is still grappling with visibility in capital spending programs and earnings growth, but investors haven’t been waiting around for the upward revisions before calling a bottom. Keep in mind, the Outlook Rank does not include timing, momentum, or relative strength factors, but rather reflects the consensus fundamental expectations at a given point in time for individual stocks, aggregated by sector.
ETF Trading Ideas:
Our Sector Rotation model, which appropriately weights Outlook, Bull, and Bear scores in accordance with the overall market’s prevailing trend (bullish, neutral, or defensive), retains a bullish bias and suggests holding Technology (IYW), Financial (IYF), and Healthcare (IYH), in that order. (Note: In this model, we consider the bias to be bullish from a rules-based trend-following standpoint when SPY is above both its 50-day and 200-day simple moving averages.)
Besides iShares’ IYW, IYF, and IYH, other highly-ranked ETFs in our SectorCast model (which scores nearly 800 US-listed equity ETFs) from the Technology, Financial, and Healthcare sectors include First Trust NASDAQ Technology Dividend (TDIV), Davis Select Financial (DFNL), and Invesco Dynamic Pharmaceuticals (PJP).
If you prefer a neutral bias, the Sector Rotation model suggests holding Healthcare, Financial, and Telecom, in that order. On the other hand, if you are more comfortable with a defensive stance on the market, the model suggests holding Utilities, Telecom, and Healthcare, in that order.
An assortment of other interesting ETFs that are scoring well in our latest rankings include First Trust Dorsey Wright Momentum & Value (DVLU), Invesco Dynamic Biotechnology & Genome (PGE), Riverfront Strategic Income (RIGS), iShares Evolved US Innovative Healthcare (IEIH), Invesco Solar (TAN), SPDR S&P Capital Markets (KCE), Invesco Financial Preferred (PGF), Aptus Fortified Value (FTVA), Arrow QVM Equity Factor (QVM), Invesco S&P SmallCap Consumer Discretionary (PSCD), Invesco S&P 500 Equal Weight Financials (RYF), Direxion All Cap Insider Sentiment (KNOW, which tracks a Sabrient index), iShares Chaikin US Small Cap (CSML), Invesco Dynamic Market (PWC), and Loncar Cancer Immunotherapy (CNCR).
Disclaimer: This newsletter is published solely for informational purposes and is not to be construed as advice or a recommendation to specific individuals. Individuals should take into account ...
more

