
Does Smart Beta = Smart Asset Allocation?
Most of the glowing analysis of so-called smart beta ETFs focuses on individual funds and how they offer advantages over their conventionally designed counterparts that weight securities by market capitalization—classic beta, as we’ll call them here. But what happens when we design portfolios with smart beta products? How do they compare with an equivalent classic beta asset allocation? It’s hard to develop solid research here because real-world track records for smart beta (SB) are still relatively short. But one set of equity SB funds has been around for more than five years, offering some perspective on what these supposedly new and improved ETFs bring to portfolio design. As we’ll see, however, the results don’t look materially different from using conventional beta products.
You can “prove” almost anything in finance if you torture the historical data long enough and backtesting asset allocation strategies isn’t immune to this caveat. But as the following analysis suggests, it’s not obvious that building a diversified portfolio with a mix of smart beta funds is a short cut to outperforming an asset allocation using conventional index funds.
What is known with absolute certainty is that smart beta indexing is hot. Bloomberg reports that smart beta ETFs are worth around $400 billion, or roughly one-fifth of total ETF assets. Deciding if SB is really a superior way to tap into markets for the long run, however, is a work in progress. Maybe, although the answer will vary depending on the product, the target market and the time period. That’s a reminder that we should proceed cautiously, thoughtfully when backtesting smart beta ETFs.
Given the wide variety of smart beta products and strategies, it’s also dangerous to generalize about this diverse landscape. Another challenge is the relatively short track records. But one group of equity funds (domestic and foreign) offered by PowerShares, based on benchmarks designed by Research Affiliates (RA), provides return records of five-plus years. The relatively lengthy run by SB standards, and indexes maintained by one of the more respected names in the niche, provides the raw material for evaluating asset allocation results.
For the test, we’ll build two portfolios—one populated by SB ETFs, the other with a set of classic beta (CB) products as follows:

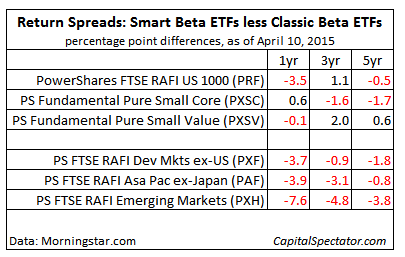
Before we look at the portfolio results, let’s review how the returns stack up on a fund-by-fund basis. As the next table shows, the performance record is mixed. It’s safe to say that the history for this batch of SB ETFs has yet to show a clear and decisive edge over the CB counterparts.

For another perspective, let’s focus on the return spreads. In the next table, we’re looking at the SB trailing return (according to Morningstar.com) less the equivalent performance for the CB fund (measured in percentage point differences). Red numbers indicate that the smart beta portfolio trailed its classic beta competitor. For instance, the PowerShares FTSE RAFI US 1000 ETF (PRF) trailed its classic beta equivalent — Vanguard Large-Cap ETF (VV) — by 0.5 percentage points for the five-year period through Apr. 10, 2015, according to Morningstar (13.95% for PRF less 14.41% for VV). As you can see, the SB results at the moment come with a fair amount of red ink.
Now let’s turn to asset allocation. For this simple test, we’ll build two globally diversified portfolios—one with SB ETFs, the other with the CB funds, with a starting date of Dec. 31, 2007. In both cases, the initial mix is echoes a market cap allocation for global equities as follows:

Each portfolio is rebalanced back to the initial mix every Dec. 31. Here are the resulting wealth indexes:

It’s clear that the two portfolios track one another closely. The SB strategy delivers mildly stronger returns for brief periods. But at the end of the five-year period there’s not a meaningful difference between the two. In both cases, a $1 investment at the end of 2007 increased by roughly 40% through Apr. 10, 2015 ($1.421 for the SB strategy vs. $1.438 for CB).
There’s also a high degree of similarity in the results via rolling 1-year percentage returns:

Risk levels are roughly equivalent as well. For instance, the top-five drawdowns are comparable. The worst drawdown for the SB portfolio in the sample period was a hefty 58% loss during 2008-2009 financial crisis. The equivalent red ink for the CB strategy was deep as well, albeit slightly less so with a roughly 56% decline.
Top-5 Drawdowns: Smart Beta Portfolio
        From     Trough         To   Depth Length To Trough Recovery
1 2008-01-02 2009-03-09 2011-01-03 -0.5825    758       298      460
2 2011-05-02 2011-10-03 2013-01-02 -0.2655    421       108      313
3 2014-09-04 2014-10-16       <NA> -0.0980    152        31       NA
4 2013-05-22 2013-06-24 2013-09-09 -0.0894     76        23       53
5 2011-02-22 2011-03-16 2011-04-01 -0.0728     29        17       12
Top-5 Drawdowns: Classic Beta Portfolio
        From     Trough         To   Depth Length To Trough Recovery
1 2008-01-02 2009-03-09 2011-02-17 -0.5573    790       298      492
2 2011-05-02 2011-10-03 2012-09-13 -0.2431    347       108      239
3 2013-05-21 2013-06-24 2013-09-10 -0.0920     78        24       54
4 2014-09-04 2014-10-16 2015-02-20 -0.0906    117        31       86
5 2011-02-22 2011-03-16 2011-04-01 -0.0752     29        17       12
The bottom line: the two portfolios are highly similar. That doesn’t mean that smart beta funds in general are worthless or that there’s no opportunity for enhancing an asset allocation strategy with strategies that embrace alternative weighting concepts. But the results above imply that it’s still going to be hard to beat Mr. Market’s asset allocation over the long run (or perhaps in the short term as well).
To be fair, the concept of smart beta is an intriguing area. Actually, it’s an old idea with a new marketing strategy. The notion of using small-cap-value stocks, for example, to boost results relative to a broad equity index has been around for several decades, delivering encouraging if uneven results. But the idea that all SB strategies will continually dispense superior risk-adjusted results at all times in all markets is assuming too much. Smart beta can be productive, but it can also pinch performance, in part because it generally costs more to run a SB portfolio vs. a classic beta strategy. Much depends on the SB funds you choose, when you use them, and the asset allocation design.
Yes, there’s opportunity in SB products, but there’s also risk, including the possibility that some SB strategies may not live up to the marketing hype. As usual in the land of active management—i.e., any strategy that deviates from a market-cap portfolio—there’ll be winners and losers. That’s true for specific funds and for asset allocation generally.
Meanwhile, you can count on average to above-average performance in Mr. Market’s portfolio, courtesy of the “The Arithmetic of Active Management.”
Skeptical? Judge for yourself by crunching the numbers in R to generate the data for the portfolio test above:
# R code for downloading prices and generating data
# for Smart Beta (SB) and Classic Beta (CB) portfolios

library(quantmod)
library(tseries)
library(PerformanceAnalytics)

get.q <-function(x) {
  a <-get.hist.quote(instrument=x,start="2007-12-29",quote="AdjClose",compression="d")
  b <-as.xts(na.omit(ROC(a,1,"discrete")))
}

prf <-get.q("prf")
pxsc <-get.q("pxsc")
pxsv <-get.q("pxsv")
pxf <-get.q("pxf")
paf <-get.q("paf")
pxh <-get.q("pxh")

vv <-get.q("vv")
vb <-get.q("vb")
ijs <-get.q("ijs")
vea <-get.q("vea")
epp <-get.q("epp")
vwo <-get.q("vwo")

port.ret.sb <-merge(prf,
                    pxsc,
                    pxsv,
                    pxf,
                    paf,
                    pxh)

port.ret.cb <-merge(vv,
                    vb,
                    ijs,
                    vea,
                    epp,
                    vwo)

# smart beta
w.sb <-c(0.40, #prf
      0.05, #pxsc
      0.05, #pxsv
      0.20, #pxf
      0.20, #paf
      0.10) #pxh

# classic beta
w.cb <-c(0.40, #vv
      0.05, #vb
      0.05, #ijs
      0.20, #vea
      0.20, #epp
      0.10) #vwo

# Generate data for portfolios
port.smt.beta.rebal.data <-Return.portfolio(R=port.ret.sb,
                             weights=w.sb,
                             verbose=TRUE,
                             wealth.index=TRUE,
                             rebalance_on=c("years"))

port.classic.beta.rebal.data <-Return.portfolio(R=port.ret.cb,
                             weights=w.cb,
                             verbose=TRUE,
                             wealth.index=TRUE,
                             rebalance_on=c("years"))

# extract data for portfolio analytics
port.smt.beta.rebal.weights <-port.smt.beta.rebal.data$EOP.Weight
port.smt.beta.rebal.contribution <-port.smt.beta.rebal.data$contribution
port.smt.beta.rebal.ret <-port.smt.beta.rebal.data$returns
port.smt.beta.rebal.wealthindex <-port.smt.beta.rebal.data$wealthindex

port.classic.beta.rebal.weights <-port.classic.beta.rebal.data$EOP.Weight
port.classic.beta.rebal.contribution <-port.classic.beta.rebal.data$contribution
port.classic.beta.rebal.ret <-port.classic.beta.rebal.data$returns
port.classic.beta.rebal.wealthindex <-port.classic.beta.rebal.data$wealthindex

# combine wealth indexes for SB and CB portfolios
port.all <-cbind(port.classic.beta.rebal.wealthindex,
                 port.smt.beta.rebal.wealthindex)
colnames(port.all) <-c("Classic Beta","Smart Beta")

# create rolling 1yr (252 trading day) data for SB and CB portfolios
port.all.252 <-na.omit(ROC(port.all,252,"discrete"))

# generate drawdown data for SB and CB portfolios
dd.sb.beta <-table.Drawdowns(port.smt.beta.rebal.ret)
dd.cb.beta <-table.Drawdowns(port.classic.beta.rebal.ret)
Disclosure: None


