
DFA Vs. SPDR In Sector ETFs
Three years ago, the ETF marketplace was clogged with new factor fund launches. The result? There are nearly 130 factor-based portfolios that have floated since 2016. Not all have survived. Still, enough are now over the three-year seasoning threshold to be considered as institutional portfolio allocations.
Among them is a quintet of multifactor sector portfolios sub-advised by Dimensional Fund Advisors (DFA) and labeled under the John Hancock Investment Management brand. These ETFs were designed to compete against funds in the capitalization-weighted Select Sector SPDR universe targeting the utilities, industrials, basic materials, energy, and consumer staples segments.
With sector rotations weighing heavily on investors’ minds now, the Hancock products are being subjected to increased scrutiny. The big question is whether factor-based sector funds actually offer advantages over the better-known Select Sector SPDRs.
It turns out that the answer is both a yes and a no. A closer look reveals why.
Utilities
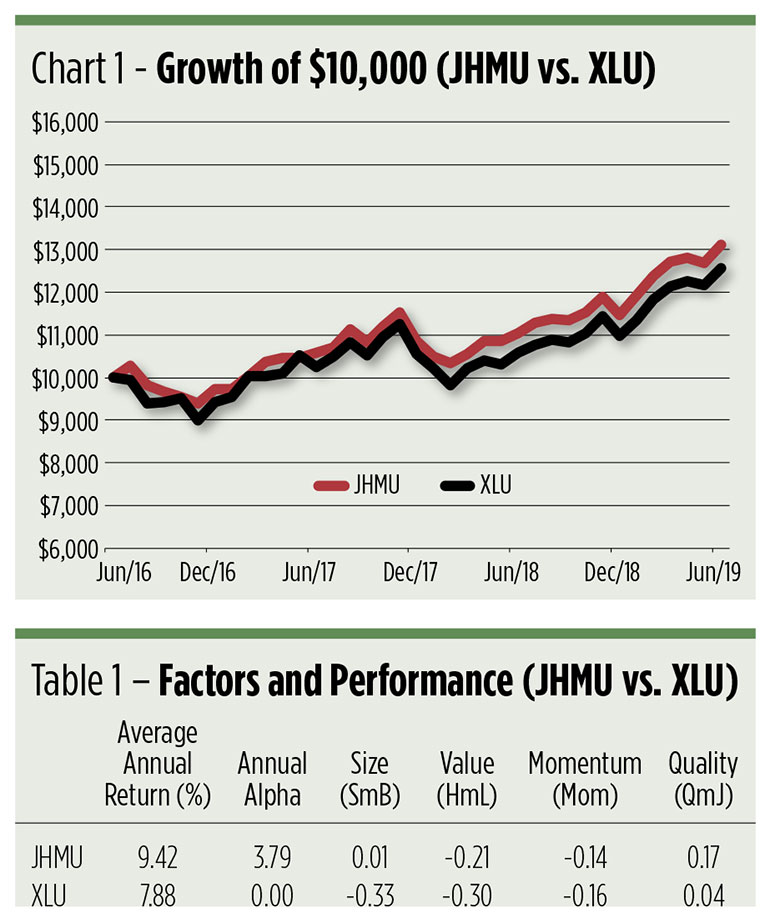
The John Hancock Multifactor Utilities Fund (JHMU), like all the ETFs in the Hancock series, pulls its constituents from the nation’s 1,000 largest stocks, reaching deeper into mid-cap territory than the S&P 500-based SPDR universe. Here, JHMU tilts against the Utilities Select Sector SPDR (XLU). Looking through a factor screen, JHMU exhibits a barely positive size (“Small minus Big”) factor compared with XLU’s, which is decidedly negative. Along the quality (“Quality minus Junk”) spectrum, there’s another significant difference between the two ETFs: Both portfolios flaunt positive readings, but the Hancock product’s got a heftier number.
Going smaller and aiming for higher-quality stocks paid off handsomely for JHMU in the form of higher average returns and alpha over the past three years. On a cumulative, month-by-month basis, JHMU has stayed ahead of XLU 94% of the time.
(Click on image to enlarge)
Industrials
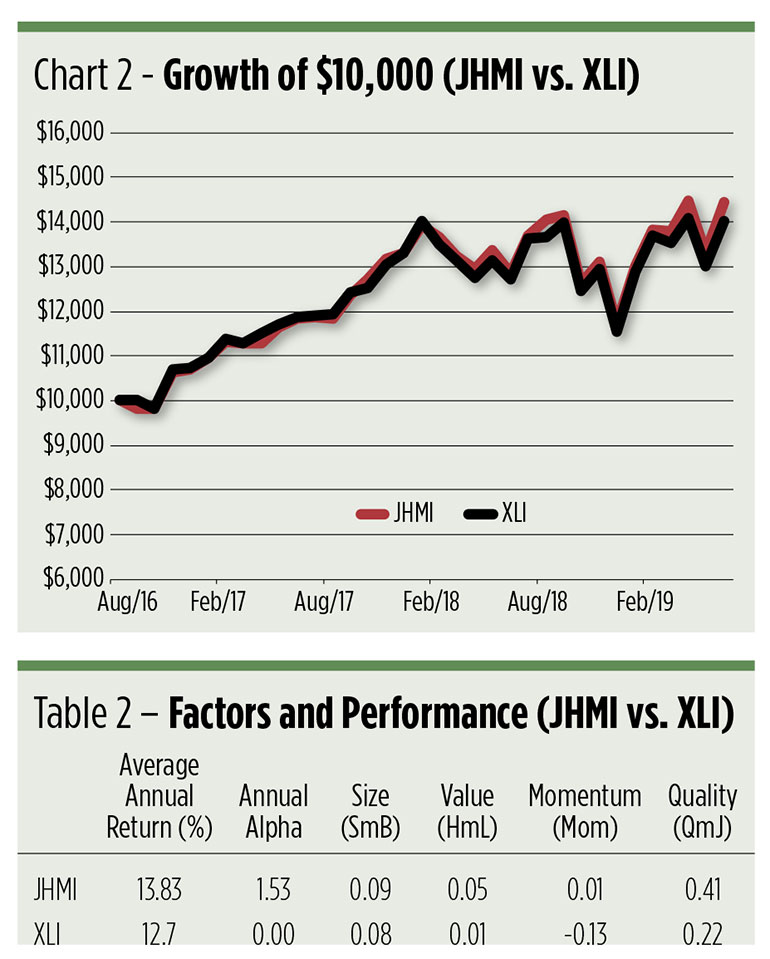
High-quality stocks also contribute considerably to the returns of the John Hancock Multifactor Industrials Fund (JHMI), more so than their influence on the Industrials Select Sector SPDR (XLI) anyway. There’s a meaningful difference in ETFs’ momentum readings as well, though JHMI can hardly be relied upon as a momentum fund.
Overall, the across-the-board factor premia earned by the Hancock portfolio contributed to its positive alpha. Month by month, JHMI led XLI 62% of the time.
(Click on image to enlarge)
Basic Materials
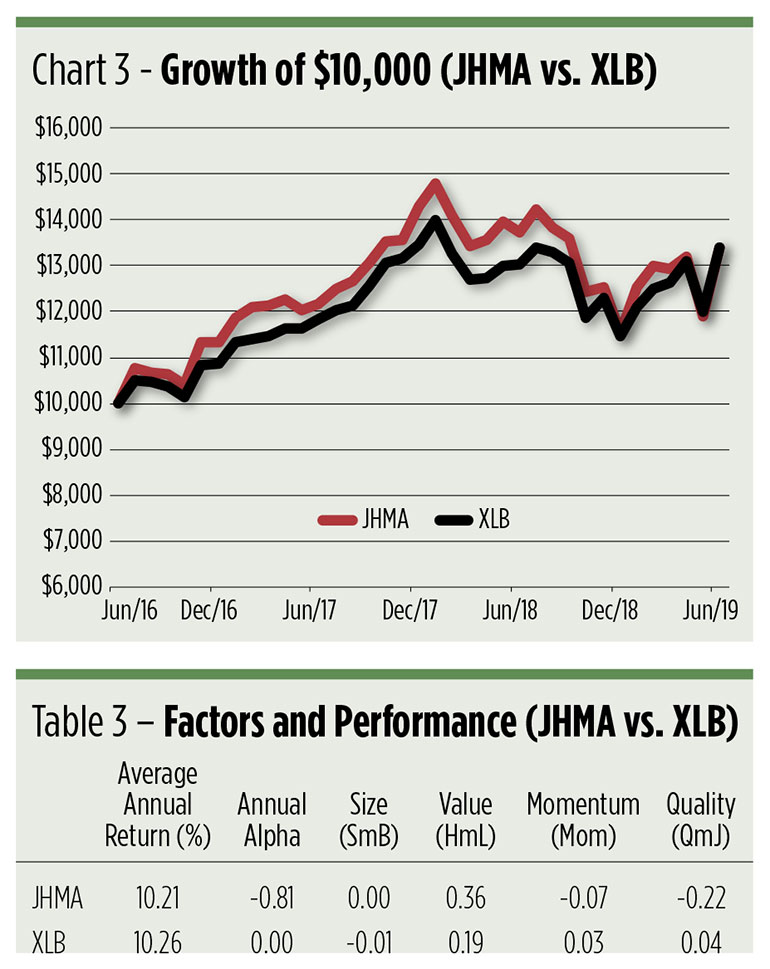
You could call the contest between the John Hancock Multifactor Materials Fund (JHMA) and the Materials Select Sector SPDR (XLB) a draw, at least on the basis of their average annual returns. There’s only a half-point difference. The Hancock fund, however, had a decided edge until just recently. The probable cause for its loss? Look to JHMA’s quality factor. Earnings are getting squeezed now as the salutary effects of the corporate tax cut wear off and trade troubles mount. Over the past three years, JHMA’s cumulative return bettered XLB’s 94% of the time.
(Click on image to enlarge)
Consumer Staples
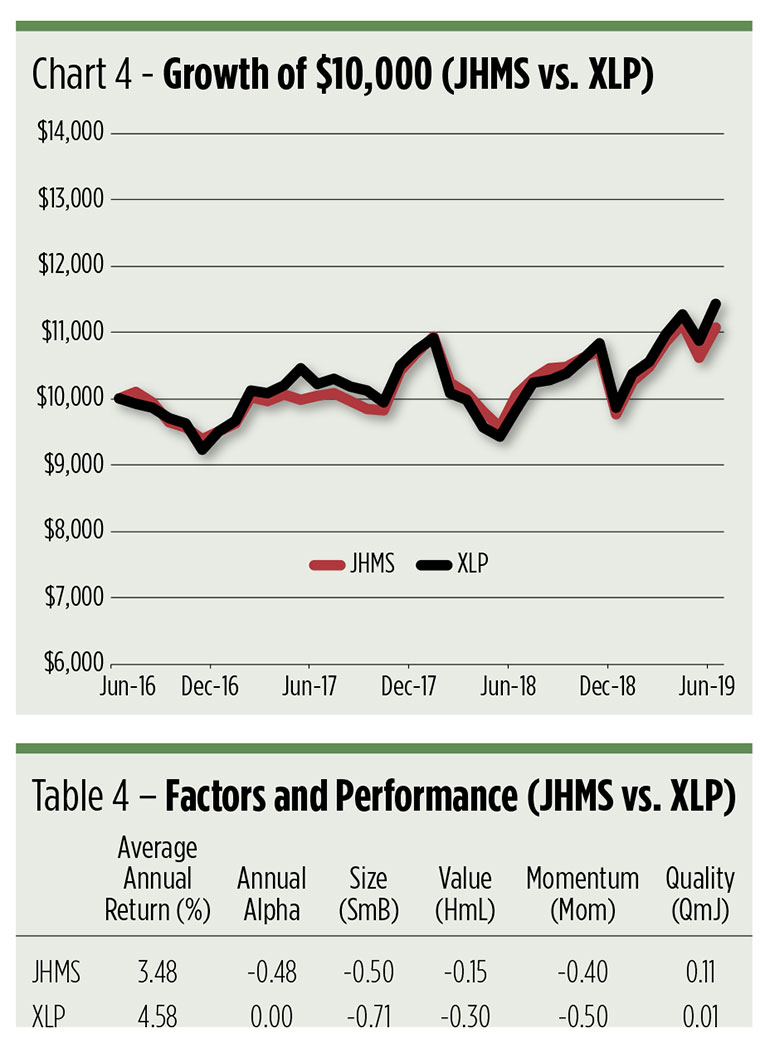
The consumer staples sector is an arena where the John Hancock Multifactor Consumer Staples Fund (JHMS) and the Consumer Staples Select Sector SPDR (XLP) have jockeyed for primacy since day one. Presently, the SPDR fund is on top.
The reason for the neck-and-neck race is fairly well spelled out in the factor table. There’s really not a heck of a lot of difference between the two ETFs. JHMS is the only Hancock portfolio that’s consistently trailed its SPDR competitor in month-by-month value. The multifactor fund beat XLP only 39% of the time. More than half of the annual alpha differential can be explained by the JHMS’ higher expense ratio.
(Click on image to enlarge)
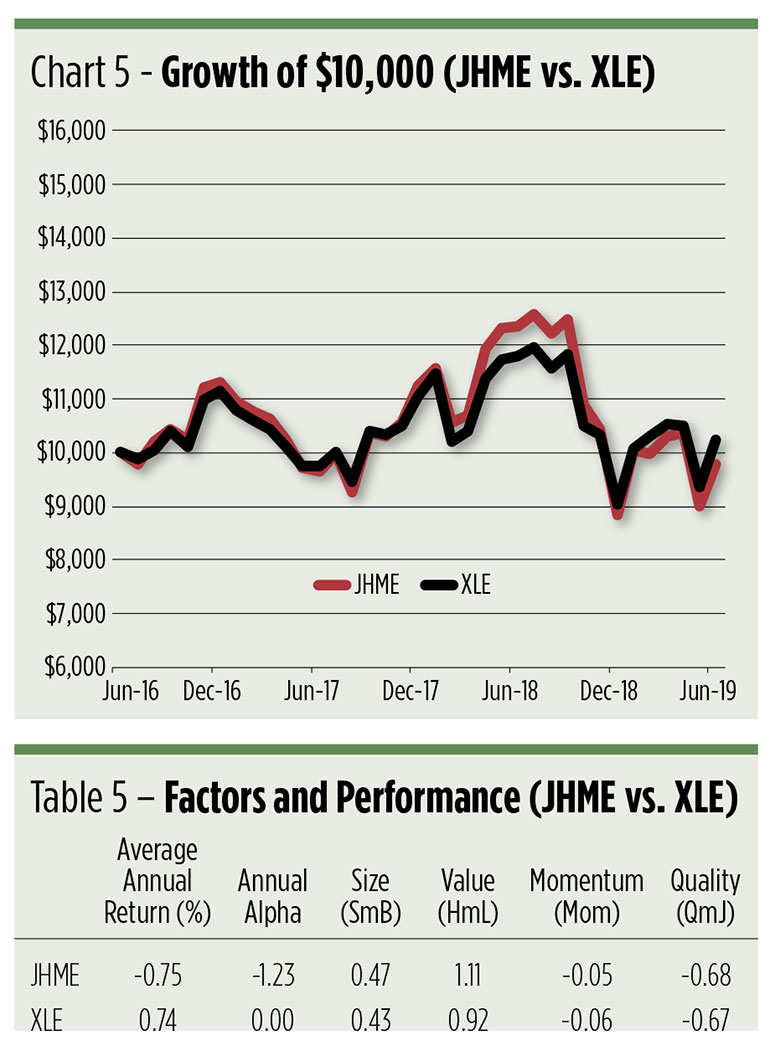
Energy
Like JHMA, the John Hancock Multifactor Energy Fund (JHME) recently gave up its edge to its SPDR competitor. The significant difference between the JHME portfolio and the Energy Select Sector SPDR (XLE) is the value (HmL) factor. The “H” in the factor’s acronym refers to a high book-to-market value ratio. Conversely, the “L” stands for a low book-to-market quotient. “HmL” translates to “High minus Low.” A positive HmL reading denotes high value, the antithesis of growth.
That value presently lags growth shouldn’t be surprising given the market’s recent trend. Growth tends to outperform in the late stages of an economic expansion cycle. Still, JHME’s cumulative return stayed ahead of XLE 61% of the time.
(Click on image to enlarge)
The Final Tally
If you look solely at average annual returns, you can’t say the Hancock multifactor funds have been an unqualified success in head-to-head competition against their cap-weighted SPDR rivals. Two Hancock ETFs have cranked out better returns than SPDRs; two have been laggards. One contest is a virtual dead heat.
But if you look at the growth of a $10,000 investment, the picture changes. In four of five cases, the multifactor ETFs bested their SPDR analogs. And not by a little. On average, the Hancock funds’ monthly cumulative returns were ahead of SPDRs’ 70% of the time.
So, are there wheels on this factor fund bus?
Yes, provided you appreciate the limitations of the multifactor strategy. DFA’s underpinning research found that stocks exhibiting low relative prices (high value) and high relative profitability (an element in the high-quality factor) produced better-expected returns over a 40-year span, regardless of sector. But the study was limited to just these two factors, so other return elements, such as size and momentum, are wild cards.
Value and other factors are expected to deliver excess long-term return as compensation for taking on more risk. Therein lies the rub. The long term, I mean. Just how long are investors likely to hold a sector fund in a portfolio? Three years? Ten? Forty? For many investors, especially those pursuing sector rotation strategies, we may be talking in terms of months rather than years. For these clients, there might not be enough time for factor premia to surface.
The risk of owning one of the multifactor funds instead of a cap-weighted SPDR portfolio, then, can be boiled down to rationalizing the higher price tag attached to the newer product. Holding the Hancock multifactor funds costs 40 basis points per year. The expense ratio for Select Sector SPDRs is just 13 basis points.
In the end, the Hancock multifactor funds have done yeoman’s work since their debut. On an aggregate basis, the quintet has cranked out a net 2.8% annual alpha coefficient. Going forward, investors and their advisors will need to decide if that justifies their 27 basis point cost premium.
Disclosure: None.


