
CoT This Week; Hedge Fund Positions
Following futures positions of non-commercials are as of June 4, 2019.
10-year note: Currently net short 467.7k, up 91.5k.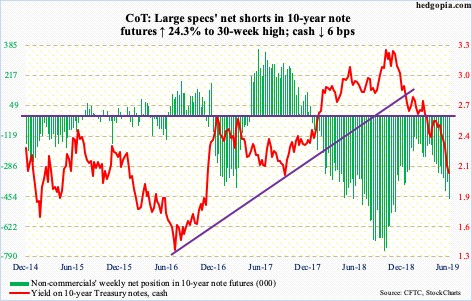
Friday’s intraday low of 2.05 percent came pretty close to testing the September 2017 low of 2.03 percent. A breach of that low will only add to momentum intact since the 10-year Treasury yield (2.08 percent) peaked at 3.25 percent last October. Since that peak, there has been a pattern of lower highs, lower lows, including this week. In the process, bond bears (price) lost major support at 2.62 percent, which goes back a decade. This was then followed by a loss two weeks ago of 2.36 percent which, the next time the 10-year rallies, is bound to act as resistance. Even before that, gap-down resistance lies at 2.18 percent.
The daily is trying to stabilize. Given the 37-basis-point drop in May, sideways action should help repair damage, so shorter-term averages begin to at least flatten out.
Non-commercials in the meantime aggressively added to net shorts in 10-year-note futures, which nothing but raises squeeze odds in the future. As price rises, yield drops.
30-year bond: Currently net short 9.5k, up 181.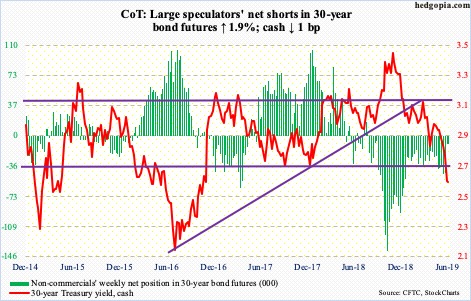
Major economic releases next week are as follows.
The NFIB small-business index and PPI – both for May – are due out Tuesday.
Small-business optimism in April rose 1.7 points month-over-month to 103.5. This was the 29th straight month of 100-plus reading, including last August’s record 108.8.
Producer prices in April increased 0.2 percent m/m and 2.2 percent year-over-year. Core PPI over the same time period rose 0.4 percent and 2.2 percent, in that order.
CPI for May is scheduled for Wednesday. In April, CPI and core CPI edged up 0.3 percent and 0.1 percent m/m. In the 12 months to April, they respectively rose two percent and 2.1 percent.
Friday brings retail sales (May), industrial production (May) and the University of Michigan’s consumer sentiment index (June, preliminary).
Retail sales in April edged down 0.2 percent from March’s record $514.3 billion; year-over-year, they rose 3.1 percent – much slower than the 6.6-percent pace last July.
In April, capacity utilization fell 0.7 percent m/m to 77.9 percent. The cycle high 79.6 percent was reached last November.
Consumer sentiment in May rose 2.8 points m/m to 100. The 101.4 reading in March last year was the highest since January 2004.
Crude oil: Currently net long 528.4k, down 8.5k.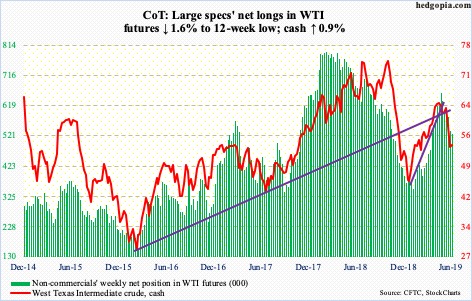
The cash ($53.99/barrel) swooned 3.4 percent Wednesday. The EIA report for the week of May 31 did not help. Stocks are accumulating. Stocks of crude, gasoline and distillates all rose – respectively up 6.8 million barrels, 3.2 million barrels and 4.6 million barrels to 483.3 million barrels, 234.1 million barrels and 129.4 million barrels. Crude inventory is the highest since July 2017. Crude production increased 100,000 barrels per day to 12.4 million bpd – a new record. Crude imports, too, rose, up 1.1 mbpd to 7.9 mbpd – a 19-week high. Refinery utilization inched up six-tenths of a percentage point to 91.8 percent.
The crude was already under pressure, having peaked at $66.60 on April 23 and having subsequently lost both the 50- and 200-day moving averages. The latest support to go was $54-55, which likely gets tested next week. Wednesday’s intraday low of $50.60 tested another layer of support at $50-51 – successfully thus far. The daily can rally.
E-mini S&P 500: Currently net long 89.9k, down 2.4k.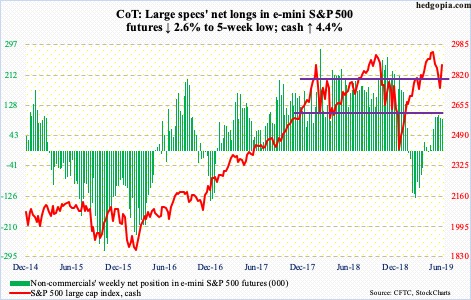
An oversold market desperate for positive news – real or perceived – got some this week. Both Jerome Powell and Richard Clarida, Fed chair and vice-chair respectively, indicated they would respond should the economy need help. Last Friday, markets reacted badly to President Donald Trump’s Thursday tweet threatening to impose five-percent tariff on Mexican imports beginning next Monday. Some GDP senators apparently warned the White House they would try to block this.
The cash (2873.34) opened the week down, but as Monday progressed, bids showed up. In the next couple of sessions, the 200-day as well as 2800-plus were recaptured. From Monday’s intraday low of 2728.81 through Friday’s high, the S&P 500 large cap index rallied 5.7 percent. Quite a reflex rally! There is decent resistance at 2890s.
At least until Wednesday, flows were not cooperating. In the week ended that session, US-based equity funds lost $12.2 billion (courtesy of Lipper). This followed outflows of $22 billion in the prior week. In the same week, SPY (SPDR S&P 500 ETF), VOO (Vanguard S&P 500 ETF) and IVV (iShares core S&P 500 ETF) lost a combined $2.5 billion (courtesy of ETF.com).
Euro: Currently net short 87.6k, down 12.1k.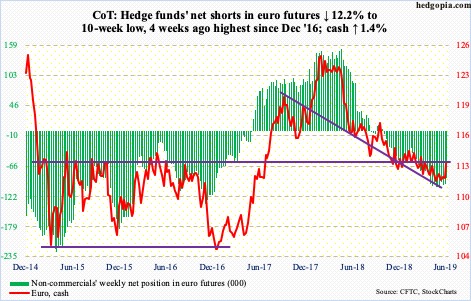
The ECB now plans to leave rates on hold through at least the first half of 2020, versus prior guidance of through the end of this year. More and more central banks are leaning dovish. Besides the afore-mentioned soothing words from the two Fed officials this week, the Reserve Bank of Australia cut rates for the first time in nearly three years. The Reserve Bank of India cut as well, even as South Korea last week adopted a more accommodative bias.
Currency cross currents are galore.
Last week, euro bulls defended one-month support just north of $111. This week, the cash ($113.39) built on that, rallying past the now-flattish 50-day and $113. There is room for the weekly to continue higher. This week’s 1.4-percent rally preceded a weekly hammer last week.
Gold: Currently net long 156.1k, up 69.4k.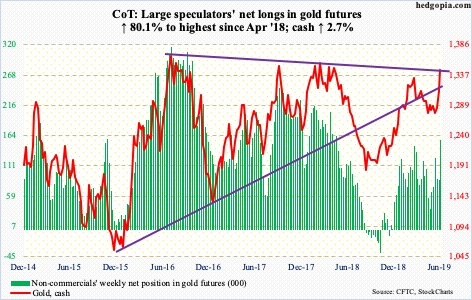
The cash ($1,346.10/ounce) has now rallied for eight straight sessions. GLD (SPDR gold ETF) in the week through Wednesday took in $694 million, while IAU (iShares gold trust) lost $31 million (courtesy of ETF.com). Non-commercials aggressively added to net longs. Through Friday’s intraday high of $1,352.70, gold was up 3.2 percent this week.
That high tested the February high of $1,349.80. Twelve sessions ago, the metal bottomed at $1,269, so has come a long way in a short period of time. The daily is beginning to look extended.
Longer-term, gold faces massive resistance at $1,350s-1,360s. A breakout is bound to reverberate through all kinds of assets.
Nasdaq 100 index (mini): Currently net long 4.2k, down 13.5k.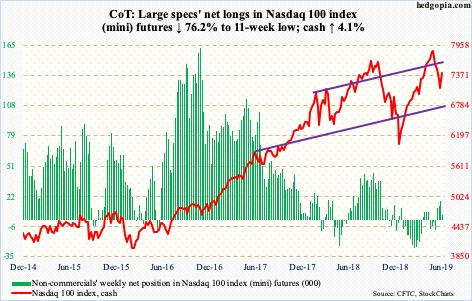
After four consecutive down weeks, bulls put their foot down this week – an outside week. From Monday’s intraday low of 6936.69 through Friday’s high, the cash (7417.29) rallied 7.3 percent. The 200-day has been reclaimed. Ditto with 7200 as well as 7300. In the best of circumstances, bulls would love to go test the 50-day, which is another 1.4 percent from Friday’s close. Flows could always improve.
In the week ended Wednesday, QQQ (Invesco QQQ trust) lost $1.1 billion. In the prior week, $355 million was withdrawn (courtesy of ETF.com).
Russell 2000 mini-index: Currently net short 28.9k, up 12.5k.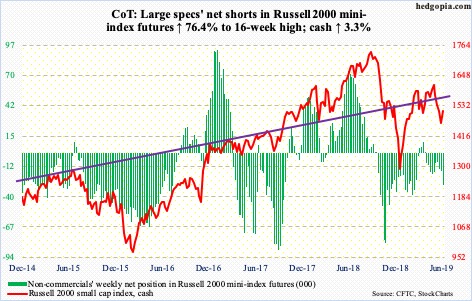
Monday’s intraday low of 1460.49 just about tested horizontal support at 1450s. The rally since saw bears quickly show up at short-term resistance at 1505-1510. The cash (1514.39) is below both the 50- and 200-day.
In the week through Wednesday, IWM (iShares Russell 2000 ETF) gained $193 million, while IJR lost $145 million (iShares core S&P small-cap ETF). Non-commercials have remained net short for several weeks now, and they added this week.
The consolation for bulls is that on both Wednesday and Thursday the 10-day was defended, although both were down sessions. Near term, this is what will decide which way momentum goes. Shorter-term averages – currently flattish – need to begin to rise.
US Dollar Index: Currently net long 26.2k, down 364.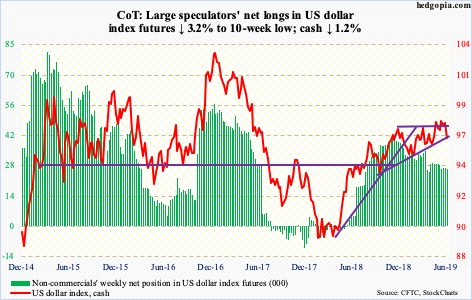
Two weeks ago, the cash (96.49) reversed hard after rallying to a two-year high 98.26. Last week, the US dollar index once again went after that level but failed just north of 98. Come Monday, it sliced through not only the 50-day but also 97.50s. The latter makes up the upper bound of a potential ascending triangle. The breakout late April has proven false.
Weekly momentum is still down. The daily can go either way. The index currently sits at trend-line support from last September. The 200-day (96.21) is right underneath.
VIX: Currently net short 85.5k, down 20.3k.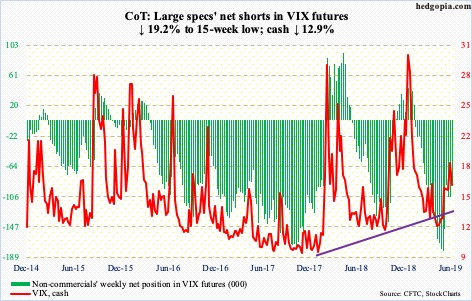
Monday’s intraday high of 19.75 was all the cash (16.30) could manage in the recent seven-session rally. On May 22, volatility bulls showed up at the 50-day. Once again, the average (15.04) is being tested. Friday, rather curiously, on a day the S&P 500 jumped 1.1 percent, VIX rallied 2.3 percent after bottoming at 15.33 intraday.
Since rallying to 23.38 on May 9, VIX has made lower highs. A breach of 14.42 from 12 sessions ago will establish lower lows. By then, the 50-day would have been lost. This is the ideal scenario for equity bulls. This would open up the door to a test of support at 12.
Should this come to pass, the 21-day moving average of the CBOE equity-only put-to-call ratio can continue to unwind. It closed Friday at 0.698, having closed Wednesday at 0.706. Historically, the ratio tends to revert from high-0.60s/low-0.70s. In the meantime, the 21-day moving average of the ISEE index, all equity, dropped to 109.8 Thursday – an all-time low. This is a call-to-put ratio. A low reading points to investor caution/fear.


