
Commitment Of Traders This Week, Futures, Hedge Fund Positions
Following futures positions of non-commercials are as of December 18, 2018.
10-year note: Currently net short 380.8k, down 13k.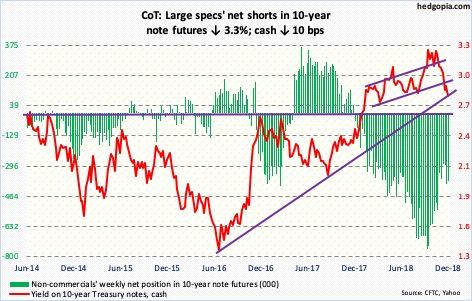
With pressure growing from diverse quarters, including the White House, to stay pat in this week’s meeting, the Fed went ahead and raised the fed funds rate by 25 basis points to a range of 225 to 250 basis points. In the futures market, a raise was priced in. Not the FOMC outlook, which probably took markets by surprise.
Prior to this week’s meeting, the dot plot expected three more hikes next year. Early October, US stocks began a sharp sell-off, even as the Treasury yield curve continued to flatten. On November 28, Jerome Powell, Fed chair, himself walked back his previous hawkish bias when he said interest rates were “just below” neutral. This was a U-turn for him. On October 3, the same day the S&P 500 large cap index began its waterfall dive, he had said rates were still “a long way” from neutral, suggesting continued tightening in the weeks/months ahead. To many, the November 28th speech was a signal that the dot plot this week would signal one hike next year, if that.
Come Wednesday, the Fed lowered 2019 projection to two hikes, leading to a mini-revolt of sort across asset classes. Stocks sold off. The yield spread between 10- and two-year Treasury notes dropped three basis points to 14 basis points in that session. In the first half this month, the spread fell to 11 basis points twice. The 10-year yield (2.79 percent) dropped from 3.24 percent on November 8 to Thursday’s low of 2.75 percent. The long end continues to warn the Fed not to get too tight. Now equities have joined credit. Not to mention the collapse in crude oil.
While it is increasingly unlikely the Fed raises twice next year, Powell may very well be sending a message to the stock market. Post-financial crisis, investors/traders have been conditioned to expect soothing words/action from the Fed as soon as stocks came under decent pressure. The so-called ‘Fed put’ was routinely set in motion under Ben Bernanke’s leadership as well as under Janet Yellen’s. At least by far, Powell is refusing to yield under pressure. Here is some perspective. Yes, the S&P 500 lost 18.1 percent from its September high through Friday’s low, but rallied 340 percent from March 2009. Powell seems to be suggesting the Fed has done enough hand-holding.
30-year bond: Currently net short 52.3k, down 9.9k.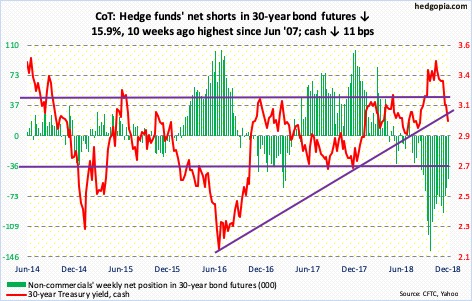
Major economic releases next week are as follows. Happy Holidays!
The S&P Case-Shiller home price index for October is due out Wednesday. Nationally in September, home prices increased 5.5 percent year-over-year. Price appreciation has decelerated from 6.5 percent in March this year.
November’s new home sales are scheduled for Thursday. Sales dropped 8.9 percent month-over-month in October to a seasonally adjusted annual rate of 544,000 units. They have been under pressure since reaching 712,000 units in November 2017.
Crude oil: Currently net long 377.1k, up 7.8k.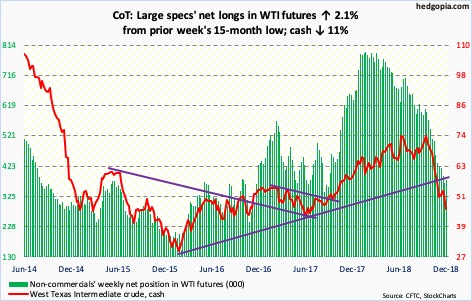
Crude oil does not act well.
Spot West Texas Intermediate crude ($45.59/barrel) went from $76.90 on October 3 – the same day stocks in general began to dive – to Friday’s intraday low of $45.13. Like that! Supply-demand dynamics or not, this cannot be boding well for the global economy.
Speaking of which, in the week to December 14, US crude production remained unchanged at 11.6 million barrels per day. Crude imports inched up 30,000 bpd to 7.4 mbpd. Gasoline stocks rose 1.8 million barrels to 230.1 million barrels. Crude and distillate stocks, however, fell 497,000 barrels and 4.2 million barrels to 441.5 million barrels and 119.9 million barrels, respectively. Refinery utilization edged up three-tenths of a percentage point to 95.4 percent.
This week, spot WTI lost another 11 percent. This was preceded by three weeks of sideways action in which it tried to stabilize, only to come under renewed pressure early this week. Immediately ahead, $50 poses resistance. Worse, there is decent support at $43-$44.
E-mini S&P 500: Currently net long 210.3k, up 36.1k.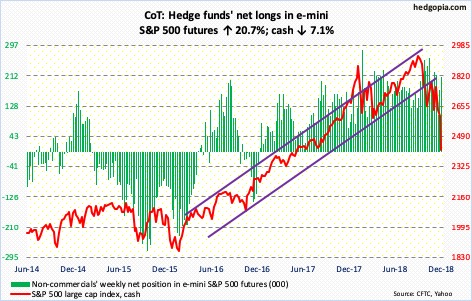
After losing record $46.2 billion in the week ended Wednesday last week, another $34.6 billion came out of US-based funds in the week to Wednesday this week (courtesy of Lipper). In the same week, S&P 500-focused ETFs saw inflows, with SPY (SPDR S&P 500 ETF) taking in $3.7 billion, IVV (iShares core S&P 500 ETF) $1.7 billion and VOO (Vanguard S&P 500 ETF) $264 million (courtesy of ETF.com), but this is nothing compared to what came out of funds. In the meantime, money-market-fund assets keep accumulating. In the week through Wednesday, these assets were north of $3 trillion (courtesy of ICI).
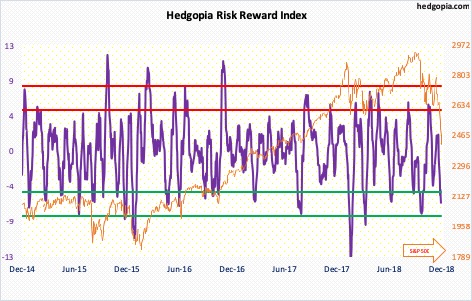
Investor preference for cash is clearly on the rise. Foreigners continue to reduce exposure to US stocks. From 2939.86 on October 3 through Friday’s intraday low, the S&P 500 index (2416.62) lost 18.1 percent. Several indicators are beginning to reflect fear. The percent of S&P 500 stocks above the 50-day moving average fell to 6.2 percent Friday, below the low of nine percent back in February 2016. Fuel for a sharp relief rally is building. Our own Hedgopia Risk Reward Index has dropped back into the green zone.
Euro: Currently net short 53.1k, down 3.2k.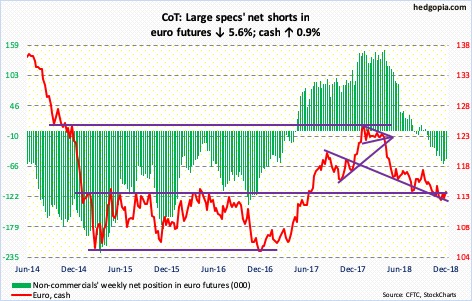
For five weeks, the cash ($114.10) traded within a pennant, which it poked its head out of this week. From bulls’ perspective, this is constructive.
The euro dropped from $125.37 early January to $112.15 on November 12. Since mid-August, bulls have more or less shown up at/near $113. The 50-day ($113.94) is trying to at least flatten out. Real test lies just north of $115, where bulls and bears have consistently locked horns particularly over the past four years. Thursday, in a long-legged doji session, it rallied to $114.86 before sellers showed up.
Gold: Currently net long 76k, up 15.5k.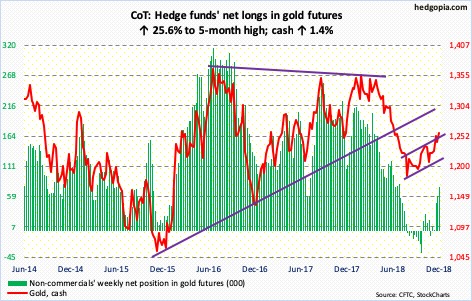
With four and a half sessions to go this month, the cash ($1,258.10/ounce) is up 2.6 percent. If it holds, this will be the third consecutive positive month after six negative ones.
Gold dropped from $1,369.40 in April this year to $1,167.10 mid-August. Since that low, it has traded within an ascending channel, the upper bound of which lies around here. The daily chart is extended. In the event of downward pressure near term, gold bugs likely will step up in defense of $1,240, which the metal broke out of early this month.
In the week to Wednesday, GLD (SPDR gold ETF) took in $329 million and IAU (iShares gold trust ETF) $14 million (courtesy of ETF.com).
Non-commercials’ net longs are at a five-month high.
Nasdaq 100 index (mini): Currently net long 3.5k, up 6.5k.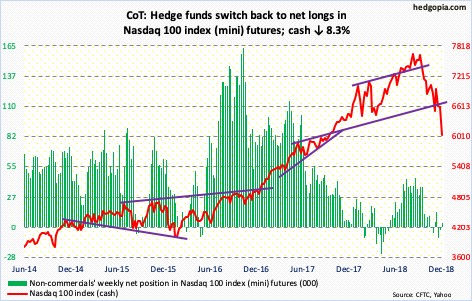
After holding 6600 for seven weeks, bulls could no longer defend that support. The cash (6046.56) not only lost that level early this week but shorts showed up there mid-week.
In the week to Wednesday, $858 million was withdrawn from QQQ (Invesco QQQ Trust). In the prior two weeks, the ETF gained $1.5 billion (courtesy of ETF.com).
Having lost one after another support, bulls have their backs against the wall. Both daily and weekly charts are in oversold territory. A relief rally is imminent. How things evolve around 6600 will be a big tell.
Russell 2000 mini-index: Currently net short 20.9k, down 990.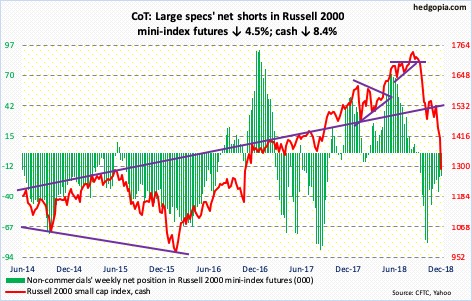
In February 2016, the cash (1292.09) bottomed at 943.10. It then reached an all-time high of 1742.09 in late August this year. A 50-percent retracement of that move rests at 1343, which has already been undercut. A 61.8-percent retracement lies at 1253. Right around there lies horizontal support going back to March 2015. A test of this is the best-case scenario for bears. Should it come to pass, the Russell 2000 would have dropped 28.1 percent. Through Friday’s intraday low of 1289.49, it is down 26 percent.
Two weeks ago, the Russell 2000 lost 1450s. Both daily and weekly momentum indicators are grossly oversold. In the right circumstances for bulls, the index can go test that support-turned-resistance.
In the week to Wednesday, IWM (iShares Russell 2000 ETF) gained $332 million, and IJR (iShares core S&P small-cap ETF) $165 million (courtesy of ETF.com).
US Dollar Index: Currently net long 36k, down 2.1k.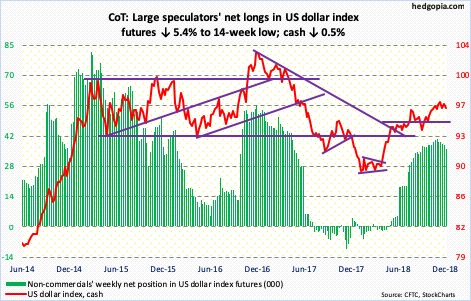
The cash (96.46) lost short-term support at 96.50-ish, but only to close out the week right at that level. Several times over November and December, it tried to take out 97.50-ish, but in vain. Since bottoming at 88-plus early this year, the US dollar index has rallied nicely. Weekly momentum indicators – overbought – have turned down. Major support lies at just north of 95. A test looks imminent.
VIX: Currently net long 44.2k, up 4.1k.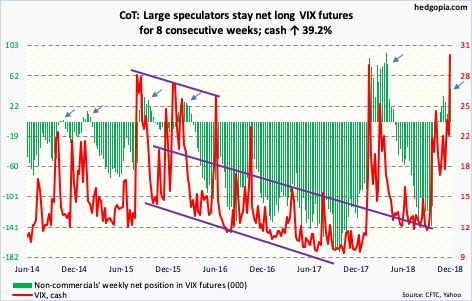
The CBOE equity-only put-to-call ratio jumped this week. Twice, readings were in the 0.90s, and Friday’s 1.13 was the highest since January 2016. The 21-day moving average ended the week at 0.741; in 2016, the ratio rose as high as 0.764 in May and 0.771 in February. This metric is beginning to reflect a decent amount of fear.
In the meantime, after more than two months of spiking to 28.84 intraday on October 11, the cash (30.11) surpassed that high later this week. Throughout this, VIX has acted relatively subdued even as the S&P 500 kept going lower.
Non-commercials continue to remain net long. It is just a matter of time before this unwinds. If past is prologue, unwinding creates a tailwind for equities.
Disclaimer: This article is not intended to be, nor shall it be construed as, investment advice. Neither the information nor any opinion expressed here constitutes an offer to buy or sell any ...
more

