
Check Out These 15 Royalty/Streaming "Mining" Stocks (And One ETF )
Royalty and streaming (R&S) companies are lower risk because they don’t mine metal themselves but contract with other mines to take part of their future output. Here are the details on all 15 R&S companies and on 1 ETF with 43% exposure to R&S companies.[TM Editors' Note: This article discusses some penny stocks and/or microcaps. Such stocks are easily manipulated; do your own careful due diligence.]
What Are Royalty and Streaming Companies?
R&S companies serve as specialized financiers that help fund exploration and production projects for cash-strapped mining companies. In return, they receive royalties on whatever the project produces, or rights to a “stream,” an agreed-upon amount of gold, silver, or other precious metal.
- Under a metal streaming agreement, the streaming company provides an upfront payment to acquire the right to future deliveries of a predefined percentage of metal production of a mining operation.
- They pay ongoing payments - a fixed sum per troy ounce of gold mined, a percentage of the prevailing metal price, or a combination of both - that are usually well below the market price of the metal.
- A royalties type arrangement usually applies to a small fraction of the mining project production (usually 1-3%) and is not connected with ongoing payments. They can have various forms, but the most common is a small percentage of the net smelter return (“NSR”). The NSR is calculated as revenues from the sale of the mined products minus transportation and refining costs.
Advantages of Royalty/Streaming Companies
- Leverage to commodity prices
- Fixed operating & cash costs ensuring consistent and ongoing strong margins
- Exploration & mine expansion upside at no additional cost
- No Capex or cost overrun exposure
- No limit to growth as execution risk does not rise with each acquisition
- No dilution
- Agreements with multiple miners spread & mitigate any potential risk
- Benefit immensely if new zones are discovered and actual production comes in higher than originally forecast
- Enjoy a favorable tax situation courtesy of the Canadian Government. As long as they reinvest their proceeds or pay it out as dividends, they are gifted with a tax rate in the neighborhood of 0-8%. That’s a huge advantage when it comes to net profit margin.
In summary, while R&S companies are not as safe as owning bullion intelligently stored, they are safer than the typical miner and with considerable upside margin over metals prices so, with all of the upside potential and little of the downside risk with mining, what is not to like? Actually, not much, and this is reflected in the performance of streaming companies versus physical metals or miners.
The above being the case, it is important to track the performance of the 15 R&S companies out there to identify which of them are well-positioned to take full advantage of the expected surge in gold and silver prices over this decade. YTD price growth is as of December 7th,2020.
- Wheaton Precious Metals (WPM)
- Streams
- Market Cap: $17B
- Stock Price Growth YTD: +42.4%
- Beta: 0.53
- Dividend Yield: 1.2%
- Purchase agreements with 17 producing companies and 9 development stage projects
- Streams
- Franco-Nevada (FNV)
- Royalties
- Market Cap: $24B
- Stock Price Growth YTD: +31.2%
- Beta: 0.61
- Dividend Yield: 0.8%
- Purchase agreements with 48 producing mines and 31 in an advanced stage of development
- Royalties
- Royal Gold (RGLD)
- Royalties and Streams
- Market Cap: $7B
- Stock Price Growth YTD: -6.9%
- Beta: 0.88
- Dividend Yield: 1.1%
- Purchase agreements with 40 producing mines and 16 development stage projects
- Royalties and Streams
- Sandstorm Gold (SAND)
- Royalties and Streams
- Market Cap: $1.4B
- Stock Price Growth YTD: +3.3%
- Beta: 1.21
- Dividend Yield: N/A
- Purchase agreements with 24 producing mines, 21 in the late development stage, 23 in advanced exploration, and 134 in preliminary exploration.
- Royalties and Streams
- Osisko Gold Royalties (OR)
- Royalties
- Market Cap: $1.75B
- Stock Price Growth YTD: +20.6%
- Beta: 0.67
- Dividend Yield: 1.4%
- Purchase agreements with 16 producing mines, 14 in the development stage and another 4 in the exploration stage
- Royalties
- Maverix Metals (MMX)
- Royalties and Streams
- Market Cap: $697M
- Stock Price Growth YTD: -1.2%
- Beta: 0.21
- Dividend Yield: 0.81%
- Purchase agreements with 13 producing mines and 16 in development stage and 71 in the exploration stage
- Royalties and Streams
- Nomad Royalty (NSRXF)
- Royalties and Streams
- Market Cap: $483M
- Stock Price Growth YTD: 855.6%
- Beta: -3.2
- Dividend Yield: 1.6%
- Purchase agreements with 6 producing mines and 6 in development
- Royalties and Streams
- Metalla Royalty & Streaming (MTA)
- Royalties and Streams
- Market Cap: $357M
- Stock Price Growth YTD: +82.6%
- Beta: 2.16
- Dividend Yield: 0.41%
- Purchase agreements with 3 producing mines, 17 in development and 26 in exploration
- Royalties and Streams
- Abitibi Royalties (ATBYF)
- Royalties
- Market Cap: $237M
- Stock Price Growth YTD: +44.4%
- Beta: 0.90
- Dividend Yield: 0.58%
- Purchase agreements with 6 producing mines
- Royalties
- EMX Royalty (EMX)
-
- Royalties
- Market Cap: $234M
- Stock Price Growth YTD: 90.9%
- Beta: 1.3
- Dividend Yield: NA
- Purchase agreements with 3 producing mines, 6 mines in development, and 107 in exploration
- Royalties
-
- ELY Gold Royalties (ELYGF)
- Royalties
- Market Cap: $133M
- Stock Price Growth YTD: +152.8%
- Beta: 0.41
- Dividend Yield: N/A
- Purchase agreements with 9 producing (or producing by 2023), 26 mines in development, and 39 in exploration
- Royalties
- Sailfish Royalty Corp. (SROYF)
- Royalties and Streams
- Market Cap: $64M
- Stock Price Growth YTD: +34.8%
- Beta: 1.0
- Dividend Yield: N/A
- Purchase agreement with 1 producing mine, 3 mines in development, and 2 in exploration
- Royalties and Streams
- Vox Royalty (VOXCF)
- Royalties and Streams
- Market Cap: $58M
- Stock Price Growth: -16.9% (since Sept.30/2020 only)
- Beta: 1.86
- Dividend Yield: N/A
- Purchase agreements with 4 producing mines, 13 mines in development (3 are near-term producers), and 31 in development
- Royalties and Streams
- Elemental Royalties (TSXV:ELE; OTC:ELEMF)
- Royalties
- Market Cap: $54M
- Stock Price Growth since August 1st: +13.2%
- Beta: 1.63
- Dividend Yield: N/A
- Purchase agreements with 5 producing mines and 1 in development
- Royalties
- Orogen Royalties (EMRRF)
- Royalties
- Market Cap: $48M
- Stock Price Growth YTD: -4.0%
- Beta: 1.83
- Dividend Yield: N/A
- Purchase agreements with 1 mine in development and 9 mines in exploration
- Royalties
Beta definition: Beta helps determine the responsiveness of a stock's price to changes in the overall stock market and, therefore, its openness to market risk.
- A positive beta value indicates that a stock generally moves in the same direction with that of the market.
- A negative beta value indicates that a stock generally moves in the opposite direction with that of the market, i.e. is less volatile than the market in general.
- A stock beta value helps the investor to decide whether he wants to go for the riskier stock that is highly correlated with the market (beta above 1), or with a less volatile one (beta below 1).
- For example, if a stock's beta value is 1.3, it means that, theoretically, this stock is 30% more volatile than the market.
- Therefore, by multiplying the beta value of a stock with the expected movement of an index, the expected change in the value of the stock can be determined. For example, if beta is 1.3 and the market is expected to move up by 10%, then the stock should move up by 13% (1.3 x 10).
There you have it but which R&S company or companies you wish to invest in depends on your own due diligence. That being said, below are the best performers in each of the categories highlighted above:
- Largest market cap: Franco-Nevada ($24B) & Wheaton ($17B)
- Greatest stock appreciation YTD: Nomad (856%) & Metalla (+83%)
- Best beta: Nomad (-3.2) & Maverix (0.21)
- Biggest dividend yield: Nomad (1.6%) & Osisko (1.4%)
- Largest number of purchase agreements with producing mines: Franco-Nevada (48); Sandstorm (24)
- Largest number of total purchase agreements: EMX (116) & Maverix (100).
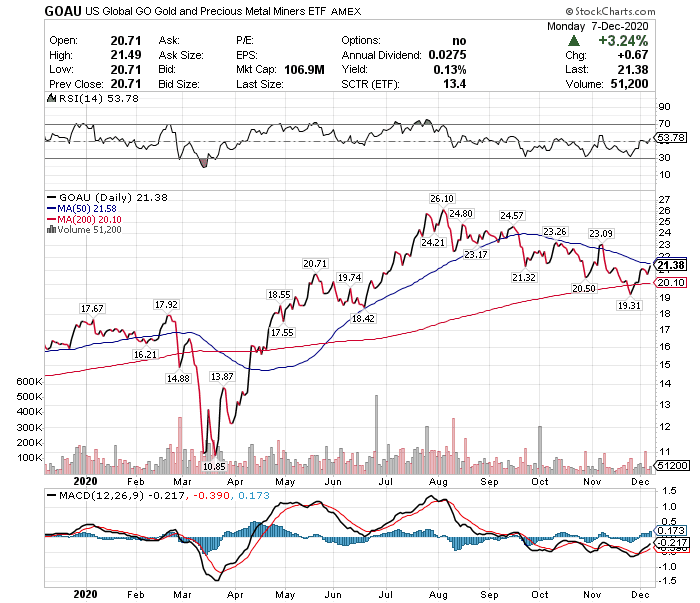
U.S. Global GO GOLD and Precious Metals Miners ETF
- If you are looking for an ETF that is heavily invested in royalty and streaming "miners" (43%) take a look at the U.S. Global GO GOLD And Precious Metals Miners ETF (GOAU).
- Market Cap: $117.6M
- Stock Price Growth YTD: +21.8%
- Beta: 0.94
- Dividend Yield: 0.38%
- Its R&S holdings, by weight, as of December 4th, are as follows:
- Franco-Nevada (10.0%)
- Royal Gold (9.4%)
- Wheaton (8.6%)
- Maverix (5.1%)
- Osisko (4.1%)
- Sandstorm (3.8%)
Price Performance
Visit munKNEE.com and register to receive our free Market Intelligence Report newsletter (sample more


