
Chance Of A Correction Increases For Emerging Markets Index ETF
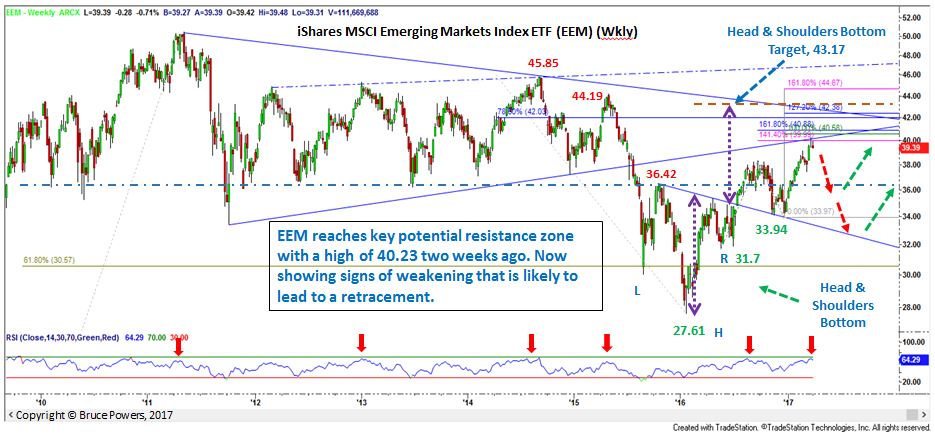
iShares MSCI Emerging Markets Index ETF (EEM) hit a high of 40.23 two weeks and has since begun to show signs that it may be starting a correction. At that high EEM had advanced 12.62 or 45.71% off the 27.61 bottom reached in January 2016. A move down to at least the uptrend line is looking likely now before this ETF is ready to make another run higher, if it is to do so.
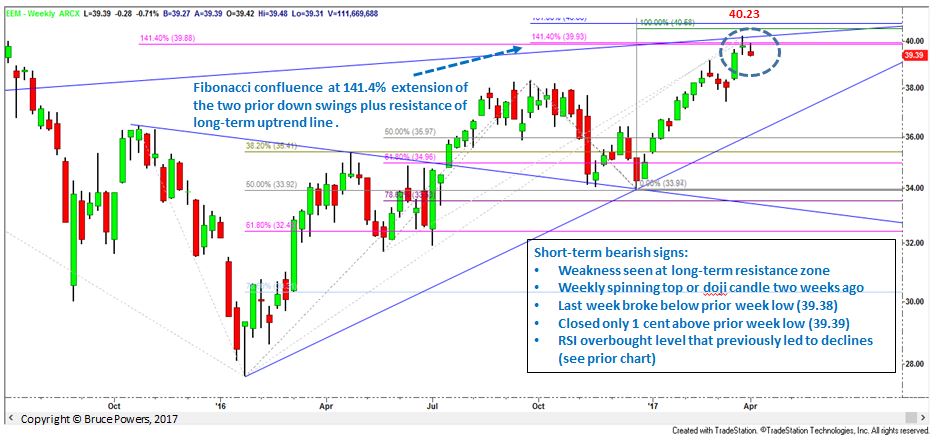
Short-term bearish signs
• Weakness seen at long-term resistance zone hit two weeks ago.
• Weekly Spinning Top or Doji candle occurred two weeks ago.
• Last week broke below prior week low – although not by much. Prior week low was 39.38 while last week’s low was 39.31.
• EEM closed at 39.39 last week, only 1-cent above prior week’s low.
• RSI at overbought level that previously led to declines (see prior chart).
• 61.8% Fibonacci retracement (38.95) of downtrend off September 2014 peak completed three weeks ago.
Note that EEM broke out of a Head and Shoulders Bottom (HS) reversal pattern in July last year, then pulled back to test the neckline as support in November/December. Price was rejected at the neckline with a Double Bottom and then rallied over the next 13 weeks before hitting resistance at 40.23 two weeks ago. That high has a good chance of holding an advance for now given that it’s at resistance of the long-term uptrend line (bottom ascending line of multi-year Symmetrical Triangle) and at two 141.4% Fibonacci extensions from two recent down swing measurements.
Whether 40.23 is the end to the long-term advance or not remains to be seen. But for now, given the bullish behavior in relationship to the HS breakout and subsequent follow-through, new highs remain a possibility following a retracement. The measuring objective for the HS pattern is above the recent high at 43.17.
A decisive drop below last week’s low of 39.31 gives the next bearish signal with a daily close below that price level confirming weakness.
January’s analysis on EEM can be seen HERE
Disclaimer: The views and opinions expressed here are solely those of the authors / contributors and do not necessarily reflect the views of more


