
Building A Tail Risk Hedge With Options

Photo by Bert Gort on Unsplash
People buy insurance for valuable assets like their home and car. Investment portfolios are typically among someone’s largest assets, yet investors rarely buy portfolio protection. When it comes to protecting one's portfolio, investors are mainly concerned with equity risk. Bonds are less volatile since future cash flows are more certain.
Buying downside protection for stocks is not unlike other forms of insurance. You pay a fixed premium and receive a payoff if a certain event happens in the future. In financial markets, options can be used to buy downside protection.
My hedge model is focused on partially hedging extreme “tail risk” events and not routine 10% stock corrections. The majority of market risk models are based on a normal distribution, which implies that financial market returns are evenly distributed. Basically, a normal distribution says that an equal amount of really bad and really good things will happen. History has shown that market returns are not normally distributed. The image below shows that significantly negative S&P 500 monthly returns (in blue) have occurred more frequently than what the normal distribution (in red) would predict.
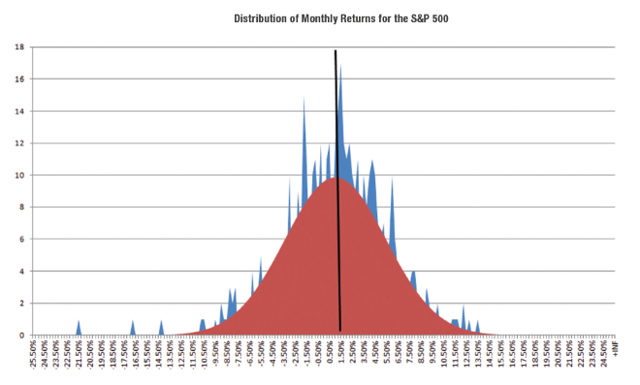
Source: Evestment
This behavior of market prices being more volatile than anticipated isn’t unique to the stock market. On October 15, 2014, the 10-year U.S. Treasury yield rose 40 basis points in a single day. This was a 7-sigma event, meaning a move of that magnitude should statistically happen once every 3 billion years (according to a normal distribution). On June 24, 2016, the British pound fell 8.1% against the U.S. dollar, a 15-sigma event. Financial markets mirror life: improbable events happen more often than anybody expects.
Hedge Structure
There are three main decisions to make when buying options: the underlying instrument, the option’s strike price, and the option’s maturity.
Underlying Instrument: I use SPY, the most liquid U.S. ETF, as the underlying instrument when hedging. SPY tracks the S&P 500 index and is highly correlated to the equity risk I’m concerned with reducing. U.S. and international stocks have historically exhibited stronger correlation in down markets. As Ben Carlson has pointed out, correlations between risky investments tend to go to one during corrections. Additionally, SPY options are more liquid than options on international stock ETFs. This translates to lower trading costs.
Option Strike Price: I use 10% out of the money puts. For example, if SPY is $280 per share, a $252 put is 10% out of the money since it’s 10% below the underlying’s current price. There’s a trade-off to make when choosing an option’s strike price. Out-of-the-money puts are less expensive since the underlying has a lower probability of trading significantly lower. In-the-money puts are more expensive since the underlying is already trading below an in-the-money option’s strike price. In-the-money options behave more like a direct short stock position and have a fairly symmetric payoff profile. In contrast, out-of-the-money options have a more asymmetric payoff profile, with gains typically being an order of magnitude bigger than losses. This is because out-of-the-money options are so cheap to begin with.
There’s no right or wrong answer when it comes to strike selection. In general, I avoid in-the-money puts because due to their high delta you might as well just reduce regular stock exposure. I also avoid super out-of-the-money puts. If you hedge with a 30% out-of-the-money put and the S&P declines 10% in a month, you have to have exceptional timing to capture the premium explosion before the option starts behaving like a melting ice cube.
Option Maturity: I buy options with six months to maturity when a hedge is placed. An option that expires in one month will be cheap since there’s a smaller window of time for a given price move to happen (making the event less probable). On the other hand, an option that expires in three years will be more expensive since there’s a larger window of time for a price move to happen. You can see this dynamic in the graph below.
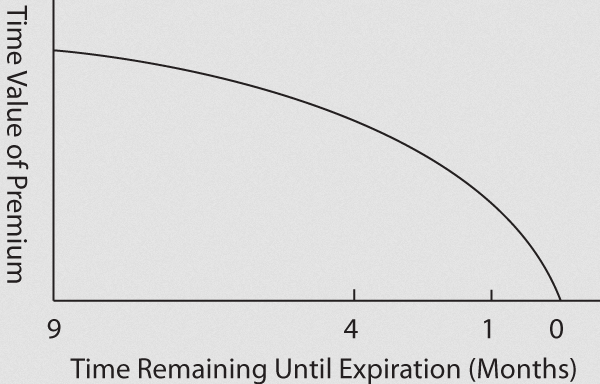
Source: Insignia Futures
Out-of-the-money options rapidly decay as they approach expiration. This is intuitive: when you’ve got less time for something to happen, the probability of that thing happening decreases, and thus the price you’re willing to pay for an option should fall. As with choosing a strike price, there’s no right or wrong answer for an option’s maturity. I avoid long-term (> 2 year) options since they’re expensive and less sensitive to short-term implied volatility that rises in a sell-off. I also avoid short-term (< 3 month) options since they have to constantly be rolled, which generates additional trading costs.
To summarize the hedge model’s structure, I use 6 month, 10% out-of-the-money puts on SPY.
Hedge Timing
I’ve tested a number of approaches rooted in intuitive hedging criteria based on stock valuations and whether volatility is high or low. I’ve found that these approaches weren’t historically effective. At first glance, valuations or volatility make sense as hedging criteria. When stock valuations are lofty and optimism is high, the risk of future drawdowns increases since there’s more room for the future to pale in comparison to high expectations.
Some investors also think that the level of volatility is a good indication of when to hedge. On the surface, this makes sense because put options become less expensive as volatility decreases. In reality, it’s tough to discern a fair value for volatility. In September 2008, the CBOE Volatility Index (VIX) was 32 — this was a very high level of volatility relative to the past. Anyone who didn’t hedge based on this seemingly prohibitively high cost of insurance regretted it in October as stocks crashed and the VIX rose to 79, making the prior VIX reading of 32 look low. History has repeatedly shown that high valuations and low volatility can persist for longer than anyone thinks possible, and this is why I don’t use valuations or volatility as criteria when hedging.
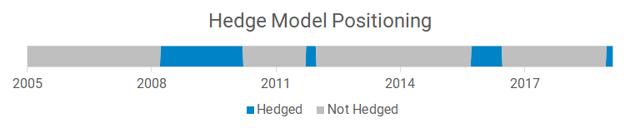
Instead, I only hedge when either the trend or macro models are out of the market. The trend and macro models are focused on one thing: reducing stock exposure when there’s a high probability of a large future loss. This is exactly what the hedge model is focused on, too. If the trend or macro models are out of the market, I take this as a warning signal for equity exposure and employ the hedge.
The graph below shows the historical positioning of the hedge model.
Hedge Allocation Size
I hedge 3% of a client’s stock exposure when the hedge model is active. For example, if a portfolio has 50% in stock exposure when the hedge is active, I would allocate 1.5% of their overall portfolio to the hedge. The allocation size of a hedge is important — too small of an allocation (like 0.25%) means any potential benefit is a rounding error, and too large of an allocation (like 5.0%) introduces a large potential drag on portfolio performance if stocks do not substantially correct.
The asymmetric nature between gains and losses in the hedge model translates to relatively small allocations making a big difference. The graph below shows the performance of the hedge during three volatile quarters:
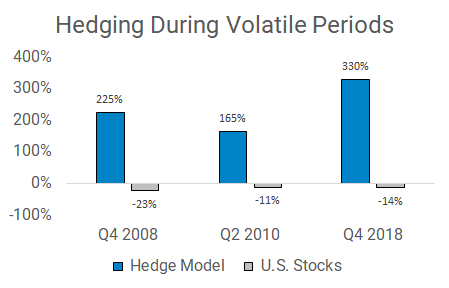
For example, if an investor’s equity exposure going into Q4 2008 was 35%, the hedge would be active and 1.05% (35% * 3%) of their account would be invested in the hedge. A 1.05% allocation to something that increases 225% translates to a 2.3% gain for the overall portfolio.
It’s important for a hedge to be assessed frequently. For example, say you placed a hedge on January 1 and the S&P 500 rose 20% by September 30. If the S&P fell -10% in October, the hedge would be significantly less effective since you were hedged for an equity correction from a much lower initial level in stocks.
I assess my hedge model at the end of each quarter. For example, at the end of Q3 2015, the trend model was out of the market. The hedge was then in place for the next quarter. This ensures that the hedge’s strike price is matched to current stock prices yet is infrequent enough so that transaction costs are extremely low.
Summary
The goal of the hedge is to further reduce stock losses when there’s a high probability of a substantial correction. I buy 6-month 10% out-of-the-money puts on SPY when the trend or macro models are out of the market.
Disclosure: Hedge strategy positioning was calculated based on the trend and macro strategies. Data on Movement Capital’s hedge strategy was created based on an interpolated series of SPY ...
more

