
Better Holdings Than The Benchmark
The Forward-Looking Fund Research Advantage
Our fund research is forward looking, not backward looking. Our Predictive Fund Rating, which leverages our more reliable fundamental data proven to generate novel alpha, for PXIIX, along with VECRX, PGICX, and PDIAX, is Very Attractive (equivalent to 5 stars).
Backward-looking investors focused on short-term performance may overlook this fund because its one-year performance lags its benchmark, iShares Core S&P US Value ETF (IUSV), and results in a 2-star rating from Morningstar.
Figure 1: Virtus KAR Equity Income Fund Ratings

Sources: New Constructs, LLC, company filings, and Morningstar
Our Very Attractive Rating for PXIIX means that analysis of its holdings reveals the fund allocates significantly more capital to highly profitable companies with low expectations for future profit growth baked into their stock prices, which makes its portfolio higher quality than its benchmark.
Virtus KAR Equity Income Fund’s Strategy Is on the Right Track
As an actively managed fund, PXIIX’s investment strategy aims to find high-quality, dividend-paying companies at attractive valuations. If that sounds familiar, it’s because our Stock Rating Methodology looks at a company’s Quality of Earnings and Valuation to derive our Stock Rating.
The fund defines high-quality companies as those with “durable competitive advantage, strong management, and low financial risk.” It identifies these companies through “extensive fundamental research” that focuses on:
- high returns on capital
- strong free cash flow
- lower earnings variability
- consistent and profitable growth
The fund’s emphasis on returns on capital, which is a similar metric to our return on invested capital (ROIC), is key to identifying quality investments. Accurately assessing a company’s ROIC is an important part of any rigorous investment process, as there is a strong correlation between improving ROIC and increasing shareholder value.
From a valuation perspective, PXIIX’s methodology is more vague, and notes that managers attempt to select cheap stocks by investing in companies believed to be undervalued relative to future growth potential.
A methodology focused on returns on capital and FCF is great in theory, but fund managers must also put their money where their mouth is and allocate capital according to their methodology. Some funds, such as Fidelity Select Leisure Portfolio (FDLSX), claim to follow a rigorous methodology, while they routinely invest in stocks with low-quality earnings and expensive valuations.
By leveraging our Robo-Analyst technology[1] to analyze the individual stocks in a mutual fund and assess holdings’ quality, we know that PXIIX’s managers follow through on their methodology.
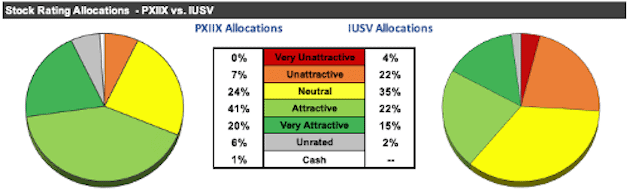
Per Figure 2, PXIIX allocates 61% of its assets to Attractive-or-better rated stocks compared to just 37% for IUSV. On the flip side, PXIIX allocates just 7% of its assets to Unattractive-or-worse rated stocks compared to 26% for IUSV.
Given this favorable allocation relative to the benchmark, PXIIX has a much better chance of generating the outperformance required to justify its fees.
Figure 2: PXIIX Allocates Capital to Superior Holdings
Sources: New Constructs, LLC and company filings
Quality Stocks Drive Very Attractive Risk/Reward Rating
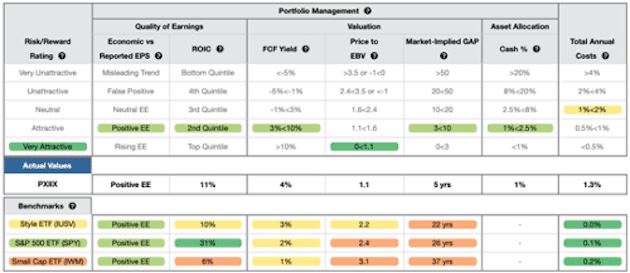
Figure 3 contains our detailed rating for PXIIX, which includes each of the criteria we use to rate all mutual funds under coverage. These criteria are the same for our Stock Rating Methodology, because the performance of a mutual fund’s holdings equals the performance of the mutual fund after fees.
Figure 3: Virtus KAR Equity Income Fund Breakdown
Sources: New Constructs, LLC and company filings
PXIIX’s holdings are superior to IUSV (click here for our report on IUSV) in four of the five criteria that make up our holdings/Portfolio Management analysis. Specifically:
- PXIIX’s ROIC is 11% and greater than the 10% earned by IUSV holdings
- PXIIX’s free cash flow (FCF) yield of 4% is higher than IUSV’s 3%
- the price-to-economic book value (PEBV) ratio for PXIIX is 1.1, which is much less than the 2.2 for IUSV
- our discounted cash flow analysis reveals an average market implied growth appreciation period (GAP) of just five years for PXIIX’s holdings compared to 22 years for IUSV
In other words, the stocks held by PXIIX generate higher quality cash flows and have lower valuations compared to IUSV. The market expectations for stocks held by PXIIX imply profits will only grow by 10% (measured by PEBV ratio) while the expectations embedded in IUSV’s holdings imply profits will grow by 120%. High historical profits and low expectations for future profits are an attractive combination.
A Deeper Dive On PXIIX’s Holdings
Out of PXIIX’s 35 holdings:
- only three receive a Risk/Reward rating below Neutral
- 18 have an ROIC greater than the fund’s benchmark
- 18 have a free cash flow yield of 3% or greater
- 26 have a PEBV ratio of 1.3 or less
- 25 have a GAP of four years or less
Given its focus on quality and valuation, it’s no wonder that 16% of the mutual funds’ assets are allocated to stocks we’ve featured as Long Ideas. Figure 4 shows the six PXIIX holdings that are open Long Ideas.
Figure 4: Open Long Ideas That PXIIX Holds
| Company | Ticker | % of Assets |
| Verizon Communications, Inc. | VZ | 4.5% |
| Omnicom Group, Inc | OMC | 4.2% |
| Snap-On Inc. | SNA | 2.6% |
| PepsiCo Inc. | PEP | 2.6% |
| McDonald's Corporation | MCD | 1.0% |
| Johnson & Johnson | JNJ | 1.0% |
| Total | 16.0% |
Sources: New Constructs, LLC
A Closer Look at a Quality Holding
With 61% of its assets allocated to Attractive-or-better rated stocks, it is not difficult to find a high-quality holding such as Watsco Inc. (WSO: $276/share).
Watsco’s Profitability Has Consistently Grown: Watsco has grown revenue by 9% compounded annually since 2009 and Core Earnings[2] by 18% compounded annually over the same time. The company improved its ROIC from 5% in 2009 to 19% over the trailing-twelve-months (TTM). Over the past five years, Watsco generated $2.4 billion (9% of market cap) in free cash flow (FCF). Over the TTM, the company has generated $159 million in FCF.
Figure 5: Revenue & Core Earnings Since 2009
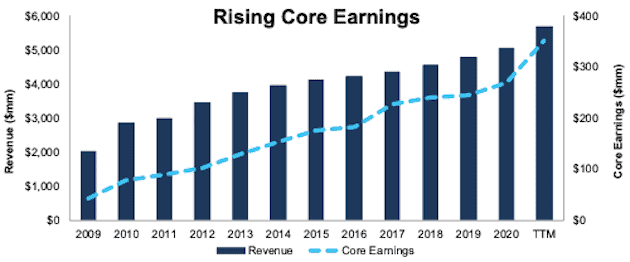
Sources: New Constructs, LLC and company filings
Expectations for Future Profits Are Too Low: At its current price of $276/share, Watsco has a PEBV ratio of 0.9. This ratio means the market expects Watsco’s net operating profit after tax (NOPAT) to permanently decline by 10%. This expectation seems overly pessimistic for a firm that grew NOPAT by 9% compounded annually from 2014-2019 before the COVID-19 pandemic.
When we use our reverse discounted cash flow (DCF) model to analyze the future cash flow expectations baked into Watsco’s stock price, we can provide clear mathematical evidence that the current valuation implies profits will not surpass TTM levels. We also provide an additional scenario to highlight the upside potential in shares if Watsco grows at consensus rates.
DCF Scenario 1: we assume Watsco’s:
- NOPAT margin falls to 6% (5-year average vs. 8% TTM) in 2021 through 2030 and
- revenue grows just 2.5% (vs. 2021-2022 consensus CAGR of 12%) compounded annually from 2021-2030
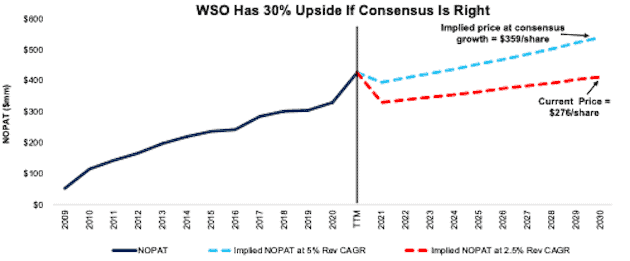
In this scenario, Watsco’s NOPAT grows just 2% compounded annually for the next decade and the stock is worth $276/share today – equal to the current price. In this scenario, Watsco’s NOPAT in 2030 is still 3% below TTM levels.
DCF Scenario 2: Shares Are Worth $359+ If Consensus Is Right. If we assume Watsco’s:
- NOPAT margin falls to 7% (vs. 8% TTM) from 2021 through 2030 and
- revenue grows at a 12% CAGR (equal to 2021-2022 consensus) from 2021-2022 and
- revenue grows by 3.5% each year thereafter through 2030, then
WSO is worth $359/share today – an 30% upside to the current price. See the math behind this reverse DCF scenario.
Figure 6 shows Watsco’s historical NOPAT alongside its implied NOPAT in each of the above DCF scenarios.
Figure 6: Current Price Implies NOPAT in 2030 is 3% Below TTM
Sources: New Constructs, LLC and company filings
Even Quality Funds Can Have Some Bad Holdings
Given that only 7% of PXIIX’s assets are allocated to stocks with an Unattractive-or-worse rating, it is more difficult to find a stock that offers poor risk/reward. However, NextEra Energy, Inc. (NEE: $79/share) fits the bill.
NextEra Energy’s Falling Profitability: NextEra Energy’s ROIC fell from 5% in 2011 to 2% TTM. The company’s falling ROIC drove economic earnings, the true cash flows of a business, from $605 million to -$2.3 billion over the same time.
Figure 7: Economic Earnings Since 2011
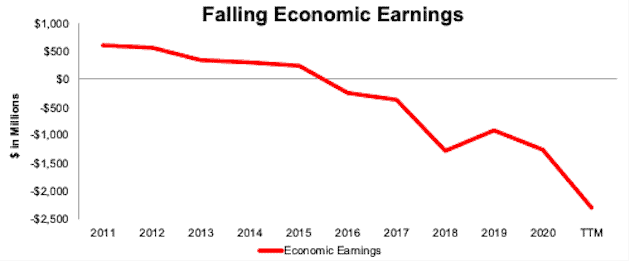
Sources: New Constructs, LLC and company filings
Profit Growth Expectations Are Too High: Despite a decade of destroying shareholder value, NextEra energy is priced for significant improvement in margins and profits.
DCF Scenario 1: To justify its current price of $79/share, NextEra Energy must:
- improve its NOPAT margin to 20% (five-year average compared to 12% TTM) from 2021 through 2030 and
- grow revenue at a 9.4% CAGR (over 4x its pre-pandemic CAGR from 2009-2019 and above consensus estimates for 8.5% CAGR through 2023) from 2021-2030
in this scenario, NextEra Energy’s NOPAT grows 12% compounded annually over the next decade and the stock is worth $79/share today – equal to the current price. In this scenario, NextEra Energy earns $9 billion in NOPAT in 2030, which is nearly 4.5x TTM levels and 2x 2019 levels.
DCF Scenario 2: Shares Are Worth $43 Even If NextEra Exceeds Historical Growth Rates. Even if we assume NextEra Energy’s:
- NOPAT margin improves to 20% (five-year average) from 2021 through 2030 and
- revenue grows at an 8.5% CAGR (equal to 2021-2023 consensus CAGR) from 2021-2023 and
- revenue grows at a 4% CAGR (twice its pre-pandemic CAGR from 2009-2019) from 2024-2030, then
NEE is worth $43/share today – 46% below the current price. See the math behind this reverse DCF scenario.
Figure 8 shows NextEra Energy’s historical NOPAT alongside its implied NOPAT in each of the above DCF scenarios.
Figure 8: NextEra Energy’s Historical vs. Implied NOPAT: DCF Scenarios
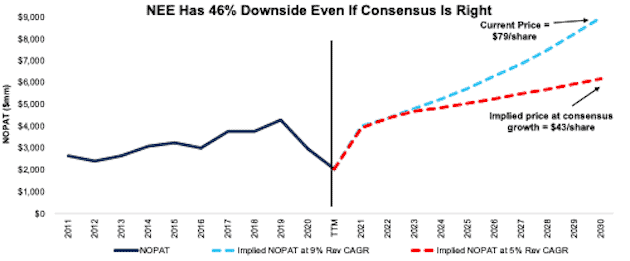
Sources: New Constructs, LLC and company filings
Each of the above scenarios also assumes NextEra Energy grows revenue, NOPAT, and FCF without increasing working capital or fixed assets. This assumption is highly unlikely but allows us to create best-case scenarios that demonstrate the expectations embedded in the current valuation. For reference, NextEra’s invested capital has grown more than 1.5x since 2016. If we assume NextEra’s invested capital increases at a similar rate in the above DCF scenarios, the downside risk is even larger.
PXIIX Provides Quality Stock Selection at an Average Price
PXIIX’s 1.3% total annual costs (TAC) are below the 1.6% average of the 843 other All Cap Value mutual funds under coverage and just above the asset weighted average of 1.2%. Figure 9 shows our breakdown of PXIIX’s total annual costs, which is available for all of the nearly six thousand mutual funds and 800+ ETFs under coverage.
Figure 9: Virtus KAR Equity Income Funds Total Annual Costs Breakdown
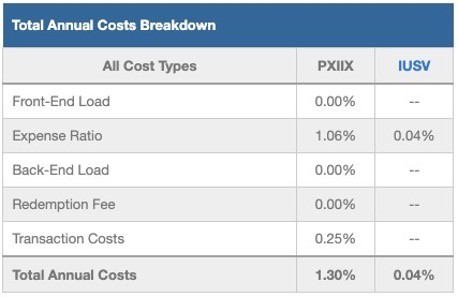
Sources: New Constructs, LLC and company filings
Investors Could Have a Portfolio With an Even Better Allocation
Despite allocating more to Attractive-or-better rated holdings than its benchmark, investors could easily improve this allocation themselves. As we showed in The Paradigm Shift to Self-Directed Portfolio Construction, new technologies enable investors to create their own fund without any fees while also enabling better, more sophisticated weighting methodologies. If instead of weighting by PXIIX’s method, we weight the fund’s holdings by free cash flow, our customized fund allocates:
- 94% of assets to Attractive-or-better rated stocks (compared to 61% for PXIIX)
- 1% of assets to Unattractive-or-worse rated stocks (compared to 7% for PXIIX)
See a detailed view of the quality of stock allocations in our customized fund vs. PXIIX’s actual allocation here. Luckily for investors willing to pay for the convenience of having a portfolio managed for them, PXIIX’s costs are manageable, as shown above.
The Importance of Sector and Holdings Based Fund Analysis
Simply buying a mutual fund or ETF based on past performance does not necessarily lead to outperformance. Only through holdings-based analysis can one determine if a mutual fund is allocating to undervalued, high-quality stocks, as PXIIX does. Click here for a free copy of PXIIX’s standard mutual fund report.
Disclosure: David Trainer, Kyle Guske II, Alex Sword, and Matt Shuler receive no compensation to write about any specific stock, style, or theme.


