
Be Creative When Searching For Growth, Lest You Just Wind Up With Empty Glamour
After having written last week about large-cap value ETFs, it seemed natural that I’d now turn to large-cap growth. But a funny thing happened on the way to the new article: I hated the ETFs I was initially seeing.
It’s not the companies in which they were invested; they were heavily into many of the most revered names we know today, and by and large, the companies really do deserve the admiration they get. My issue is with portfolio construction: The generic algorithms simply didn’t seem to be delivering what I thought a bona fide growth strategy should deliver.
But there is good news. Analogous to what I found with large-cap value, more interesting candidates can be found when one is willing to look in less-obvious ways.
Why Growth — Now — And Always
Just because a style-classification scheme has been in unquestioned use for decades doesn’t mean it provides genuinely helpful information to investors. Growth cannot now, or ever, be avoided by equity investors. It’s the only reason to own stocks as opposed to fixed income.
Many fixed-income securities have higher yields and feature far less volatility, not to mention contractual 100-cents-on-the-dollar payouts (that are breached far less often than equity expectations).
Implementing A Growth Strategy
Growth, value, and quality are always inextricably intertwined, and are so in a way that allows an investor to tolerate higher and higher valuation ratios, so long as these are balanced by suitably high growth (and/or quality). It’s never really a question of growth or value. It’s a matter of how much investors should tolerate in terms of current price relative to how much one can expect in future corporate wealth generation, and how much faith one wishes it place in any such expectations.
That brings us to the hard part. We know how high the valuations actually are (the numbers are right in front of us, so all we need do is look). But it’s difficult to figure out how much growth we’re getting because we can’t see it: What we care about is the unseeable future.
That can only be addressed indirectly through cues as to what the investment community as a whole anticipates for the future. The details are beyond the scope of this post. What’s important for now is to evaluate Growth ETFs with an eye toward whether or not portfolio construction is such that it is likely tapping into those future-oriented expectations. We must also keep in mind the need to distinguish cues that arguably suggest credible expectations (even if imperfect, as these things always are) versus just plain “noise.”
Why I Dislike Conventional ETF Growth Portfolio Construction
Let’s consider one of the giants in the field: the ultimately-passive Vanguard Growth ETF (VUG), with about $47 billion in assets under management (AUM); and a niche ETF at the other end of the spectrum: tiny, actively-managed SPDR MFS Syetematic Growth Equity ETF (SYG), with a less than $35 million in AUM, but a Number 1 Group Rank among Small Cap Growth ETFs.
VUG relies on the well known CRSP Index family that, in essence, rates stocks based on value and growth factors and works with them, as growth indexes favor stocks with good growth factors and poor valuation factors, and vice versa for Value Indexes.
That does exactly what financial theory tells us we should not be doing; treating growth and value as antagonistic styles. This approach, plus market-cap weighting (another old-standard in the world of ETFs), produces a portfolio that is 17.7% invested in FANG stocks: Facebook (FB), Amazon (AMZN), Netflix (NFLX), and both classes of Google (GOOG) and (GOOGL). Add in Apple (AAPL) and Microsoft (MSFT), as some do, to come up with FANMAG; and now, we’ve accounted for 36.7%. VUG owns 274 positions, but how much do any of the 63.3% matter?
As stylistically opposed as miniature SYG is, it still devotes 29.1% of its 50-stock portfolio to MSFT, AAPL, AMZN, and GOOG.
If I want larger cap exposure, I’ll invest in large cap; I don’t need VUG or SYG to give me back-door access to this style. I and everyone else knows what FB, AMZN, NFLX, GOOG, GOOGL, MSFT, and AAPL are. Anyone who has a bullish conviction regarding those names and believes they still have far to run would probably be better off just buying them and not watering down exposure with the rest of the ETF portfolios, which in the aggregate, may or may not have the same risk factors.
Finding A Good Growth ETF
First, I’m giving up on large-cap growth. I’m switching to just plain growth and screening on Portfolio Wise for all aspects of the style (all-cap, large-cap, mid-cap and small-cap). Yes, smaller cap carries greater risk, but then, too, that’s what one who wants to bet heavily on future growth expectations needs to be ready to take on — one way or the other.
Second, I’m willing to go small in terms of AUM, so long as I’m not going so small as to wonder if the ETF issuers are going to change their mind and close it down soon. (See last week’s post for more on the AUM issue.)
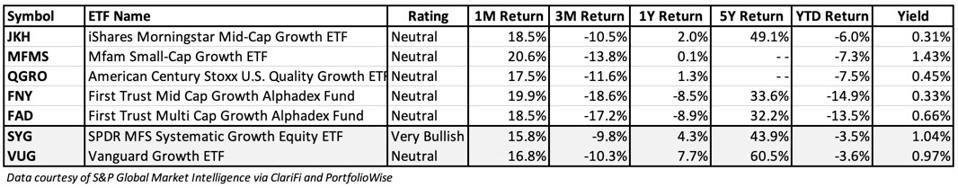
And, as I did last week with large-cap value, I’m going to treat Group Rank and the name of the ETF as valuable information. Tables 1a and 1b list the growth ETFs I selected for further review. (For purposes of comparison, VUG and SYG are shown with a grey background.)
Table 1a:
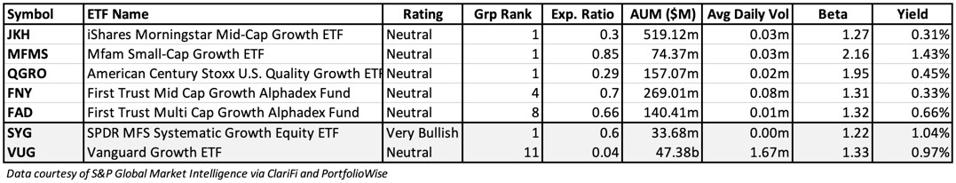
Table 1b:
As I look deeper, here’s what I’m hoping to see:
- A non-standard growth industry allocation.
- An interesting, non-generic, investment strategy (I check the prospectuses for these).
- A non-standard portfolio that is not concentrated in the same-old-names.
- Some sort of quantitative validation as reflected in recent relative performance numbers and/or stock Power Gauge factor scores.
I know reality is not going to deliver perfection in every respect. It never does. So there’s some weighing and balancing here. But I like what I see in this little list.
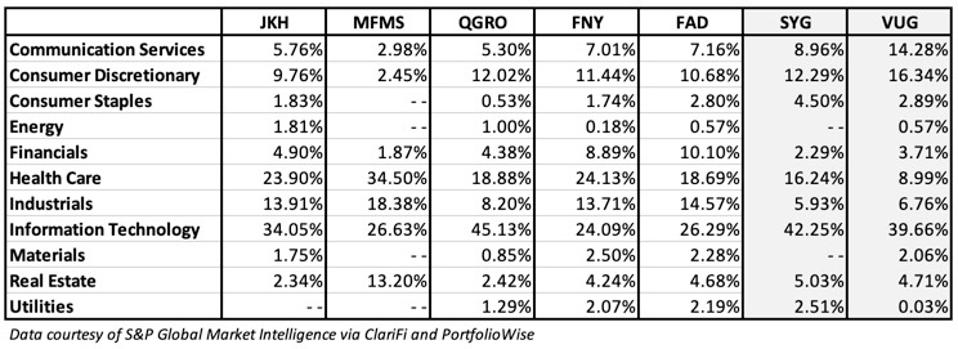
Before discussing individual funds, let’s get some numbers out of the way (in addition to the performance and group rank numbers shown above in table 1b). Table 2 shows the sector allocations.
Table 2:
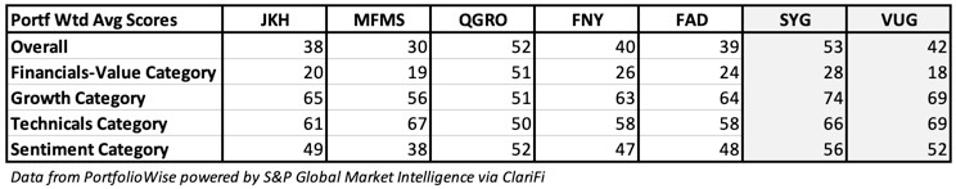
Tables 3a, 3b, and 3c supply some model-based validation. Table 3a shows weighted average scores for the Chaikin Power Gauge model (0 - 100 with 100 being best), and for each of the four major factor categories.
Table 3a:
Speaking of value-related factors, let’s take a look at Table 3b, which shows portfolio-weighted averages for these ETFs.
Table 3b:
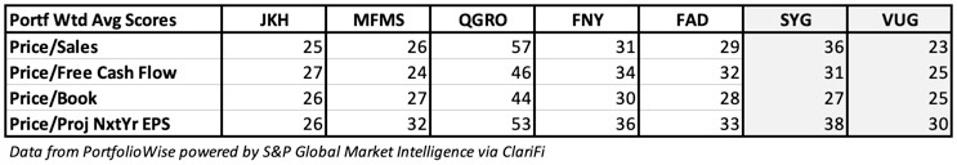
Most are not good. (Are you wondering yet about the outlier, QGRO? I’ll get there.) But we don’t have to walk away just because the value scores stink. We’re talking about growth today.
As noted above, we can take on poor value ranks if we have reason to anticipate the high prices we pay will be at least justified, and hopefully more than justified, by very strong growth (just like noted Value guru Bill Miller did back around 2000 when the world thought he was out of his mind for having gone in heavily on early-days AMZN); but again, only if we have reason to believe our cues aren’t illusory due to what is, in reality, market cap weighted run-ups or active performance chasing.
Table 3c gives us a head start here by translating investment-community rhetoric to hard data via representative Power Gauge scores for factors, which I believe serve well as indicators of bona fide expectations.
Table 3c:
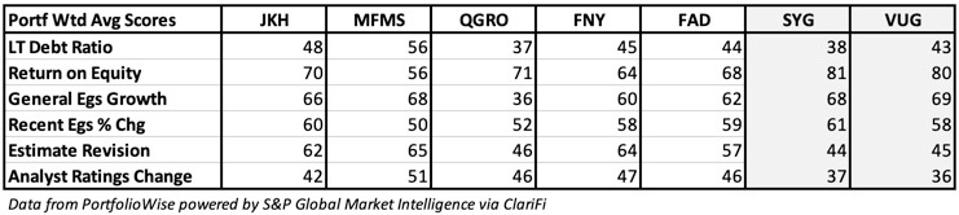
Now, we’re looking a lot better than we were when we concentrated on valuation ratios.
Note that VUG and SYG also look good on these numbers! But unlike the others, these ETFs get their good numbers by heavily weighting a small number of everybody-wants-them-nifty stocks. The others are better spread throughout the portfolios. So to my mind, given what I’m looking for, the “quality” of the scores is higher for the smaller ETFs.
Now, with no further ado, let’s consider the non-generics.
Interesting Growth ETF Candidates
iShares Morningstar Mid-Cap Growth (JKH): With an issuer named Morningstar (and the army of human analysts it employs), you might think this is an active ETF, but it isn’t. Analyst projections become data items and, for stocks not covered by analysts, Morningstar uses an algorithm to try to approximate what human analysts would come up with. So it can, and does, have a rules-based Growth ETF based on what its prospectus refers to as “companies that typically have higher than average historical and forecasted earnings, sales, equity, and cash flow growth.”
The Power Gauge portfolio weighted averages (Table 3c) suggest its algorithm is picking growth stocks that we also regard as good. Recent ETF performance and the top Group Rank among mid-cap growth add validation. The portfolio holds 171 positions, with the largest having a 1.8% weight, and the top 10 comprising only 13.7%.
Mfam (Motley Fool Asset Management) Small-Cap Growth (MFMS): I have to be getting old. What else can I think when I see that Motley Fool, the one-time clown-hat wearing bad-boys of the internet cheering on the late-1990's bubble by citing significant overvaluation as desirable for stock selection, grew up into an established newsletter provider and a genuine asset manager; and from what I can see (as I look at this small-cap ETF), a pretty good one.
I can’t imagine any right-minded investor arguing with the ETF’s prospectus, which states that its managers do “research to evaluate each company under consideration using four criteria ... (i) management, culture, and incentives; (ii) the economics of the business; (iii) competitive advantage; and (iv) trajectory. The Adviser’s approach prizes a long-term mindset and a balance of qualitative and quantitative factors.” The big question is how do-able this is. Many say “no way” and that this is much easier said than done in the real world, and that active management, which is what MFMS does, is bad.
I did this sort of stock analysis for a long time so I know how hard it is. But our objective Power Gauge model gives a thumbs-up to what the managers here have been doing and I very much appreciate the non-standard sector weightings (Table 2), which suggest the managers aren’t just crowd following, but they really are digging.
By the way, the Real Estate allocation does not consist of REITs. The allocation is mainly in development and management companies. MFMS holds only 31 positions (a human-managed fund can only hold so many). The top-weighted holding, at 7.1%, is Everbridge (EVBG); number two, at 6.6%, is Paylocity (PCTY), and the top 10 combine for 46.3%. I’ve got to write a letter to my 20-year younger self that starts with “You’ll never guess what I bought!”
American Century Stoxx U.S. Quality Growth ETF (QGRO): I’m a quality-lover, especially now, when risk in the market is elevated, and given that the investment community, so wired into growth versus value, often overlooks quality. The starting point here is the STOXX USA 900 Index. As often happens in the ETF world, a score is calculated; here, for growth, based on sales, earnings, operating income, profitability and cash flows. Nice, but not unique in and of itself.
The good part is that, before getting any growth score at all, the company has to first pass through a preliminary screen based on such quality measures as profitability, return on assets, return on equity, and gross margins. That’s the best way to use ranks — against a pre-qualified universe. Highly ranked quality-growth stocks are then weighted by their growth scores.
So what about value? It’s not implicitly part of the algorithm, but as I said, quality tends to be under-appreciated; so, voila, we have very respectable Power Gauge value-oriented factor scores. QGRO holds 200 positions and is not anti-big-name; AMZN is the second largest holding, but the stake is only 3.1%. The top position amounts to 3.4%, and the top 10 combined add up to 24.4%. As I said last week, with a value-quality ETF (from a different issuer), I’m in!
First Trust Mid-Cap Growth Alphadex (FNY), and First Trust Multi Cap Growth Alphadex (FAD): Like the CRSP index used by VUG, First Trust’s Alphadex protocol (based on NASDAQ indexes) starts by computing separate ranks based on growth and value. But in contrast to the CRSP methodology, NASDAQ does not pit growth and value against one another. Growth stocks (as selected by NASDAQ) are given growth scores only, and value stocks are given a value score only. Better still, compared to CRSP, NASDQ slips a value item (sales-to-price) into the growth collection that otherwise looks at one-year sales growth, as well as three, six, and 12-month price appreciation (relative momentum is an often under-appreciated cue regarding growth expectations). Thumbs up to that!
Stocks in First Trust’s Growth ETFs are those that rank better under the NASDQ growth formulations. Moreover, First Trust does not market cap weight. The portfolio stocks are divided into five buckets based on growth score. The bucket holding the highest ranked stocks gets the highest weight within the portfolio, and the bucket with the lowest growth ranks (but still good enough to at least get into the sort) get the lowest weight. But within each of these five buckets, the stocks are equally weighted. I get that this is a bit of a brain twister.
Suffice it to say, each portfolio has companies scored only for growth, and that the allocations are such that companies with better scores are more likely to have higher weightings. FAD holds 673 positions, with the weight of the largest position being only 0.7%. FNY, drawing from the less populous mid-cap group only, has a “mere” 225 positions, with the largest having a weight of only 1.8%.
So both ETFs do a lot of genuine risk-spreading among companies well-ranked for growth, without being overwhelmed by the shadow of FANG or FANMAG. Between FNY and FAD, I’d give a slight nod to FNY, with its 4 (out of 8 group rank, versus 8 (of 11) for FAD. But in all fairness, FAD is up against more big-cap performance chasers.
Conclusion
All of these non-generics make legitimate efforts to truly capture expected growth, and do so without over-reliance on performance chasing or shadow momentum (via cap weighting of polar names that are running fast and hard). MFMS is a human conviction play. The others spread risk widely, and it makes sense, given the heightened uncertainty that is inherent in all they’ll-eventually-grow-into-their-valuations situations.
Disclosure: None.


