
Assessing If Now Is A Good Time To Buy The Technology Select Sector SPDR ETF
The Technology Select Sector SPDR ETF (XLK) is one of the largest and most popular ETFs tracking the technology sector. The ETF has nearly $20.5 billion in assets under management, and it charges a conveniently low annual expense ratio of 0.13%.
Besides, the Technology Select Sector SPDR ETF has one of the longest track records in existence among sector-specific ETFs, which makes it an ideal choice for investors who want to implement quantitative trading strategies supported by backtested performance.
In addition to this, the ETF is focused on technology companies that are also included in the S&P 500 index. This means that watching the price action in XLK is quite important if you are looking to evaluate the impact that the technology sector is having on the broader S&P 500.
It's important to note that the technology sector is the biggest sector component in the S&P 500 by a wide margin, accounting for more than 20% of the index. Besides, technology is a high growth sector that has a big impact on investor sentiment.
And it's not just about the broad market environment. Many of the most promising growth stocks in the market are in the technology sector. At the individual stock picking level, it makes a lot of sense to keep a close eye on the technology sector in the search for opportunities.
In that spirit, let's take a look the Technology Select Sector SPDR ETF considering key aspects such as breadth, long-term trends, and medium-term indicators.
Broad Participation
The technology sector has been leading the broader market by a considerable margin over the past year, as reflected in the below chart comparing the Technology Select Sector SPDR versus SPDR S&P 500 (SPY)
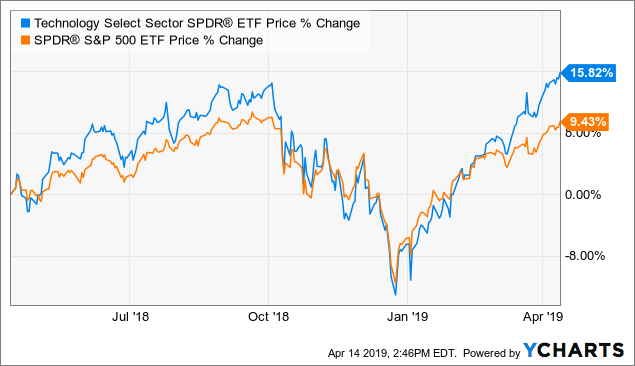
Data by YCharts
However, it's always important to remember these ETFs are weighted by market capitalization in their portfolio composition. This means that large companies tend to have a much bigger impact on overall ETF performance than smaller companies.
It's good to see the tech ETF moving higher on broad participation from a large number of stocks, because this tells us that there is a bull market in technology stocks in general. However, if the ETF is being pushed higher by a small group of companies with a big weight in the portfolio, then the rally is far more narrow and company-specific.
The table below shows the return attribution numbers for the Technology Select Sector SPDR ETF on a year-to-date basis at the industry level. In other words, the table shows how much each industry weights on the technology sector and what kind of impact it is having on returns.
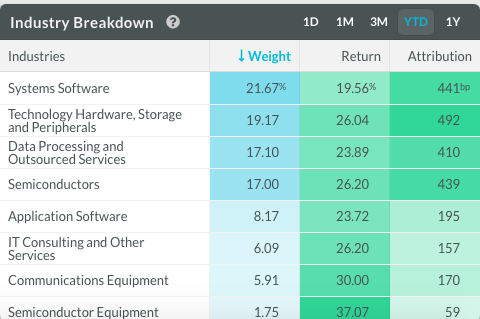
Source: Koyfin
As we can see, there is broad participation in terms of the different industries, so the Technology Select Sector SPDR ETF is being driven by vigorous breadth in terms of industry composition.
Looking at the return attribution for individual stocks, participation is very healthy among the top stocks in the portfolio.
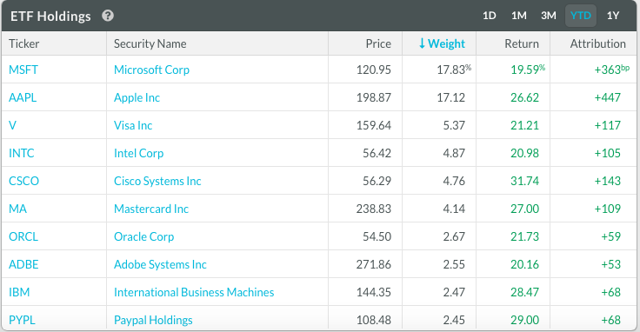
Source: Koyfin
In other words, the current rally in the Technology Select Sector SPDR ETF is being supported by wide participation from different industries in the tech sector, and most of the main individual stocks in the portfolio are moving in the right direction too.
The Long-Term Trend
The Technology Select Sector SPDR ETF has created a lot of value for investors over the years, but it has also suffered massive drawdowns in periods such as the tech bubble in 2001 and the financial crisis in 2008. From a risk and reward perspective, it makes a lot of sense to apply a trend-following indicator to such an explosive instrument.
The 200-day moving average is a remarkably simple and effective trend indicator. The chart shows the evolution of the ETF and the 200-day moving average since December 31, 1999. Below - in green - we can see the equity curve for a quantitative strategy that only buys the Technology Select Sector SPDR ETF if it is trading above the 200-days moving average.
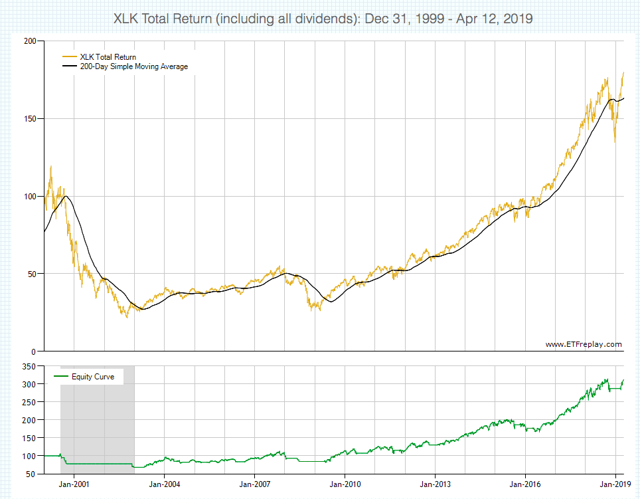
Source: ETFreplay
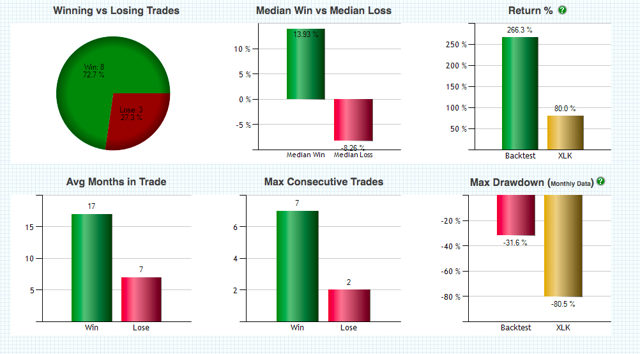
The strategy is remarkably simple. Every month you watch the Technology Select Sector SPDR ETF and the 200-day moving average as a trend indicator. If the ETF is above the 200-day moving average, then you go long the ETF. Conversely, if the ETF is below such a moving average, the portfolio is allocated to cash.
Backtested performance statistics are quite solid. The trend-following strategy produced a total cumulative return of 266.3%, significantly outperforming the cumulative gain of 80% produced by a buy and hold position in the ETF over such a period.
Source: ETFreplay
Importantly, implementing a trend-following strategy can substantially reduce downside risk too. The maximum drawdown - meaning maximum capital loss from the peak - is a staggering 80.5% for buy and hold, while the maximum drawdown for the trend following strategy is a far more modest 31.6%.
When investing in the technology sector, both the potential returns and the downside risk are quite substantial. Implementing a trend-following strategy can be a great way to optimize performance and control downside risk in these cases, and the long-term trend indicators currently look bullish for XLK.
The Medium-Term Trend
Moving averages can be very effective indicators when the asset price is in a well-defined trend, either up or down. However, in a sideways market, moving averages tend to produce too many false signals. Because of this, price channels can be a great complementary tool to use in conjunction with moving averages.
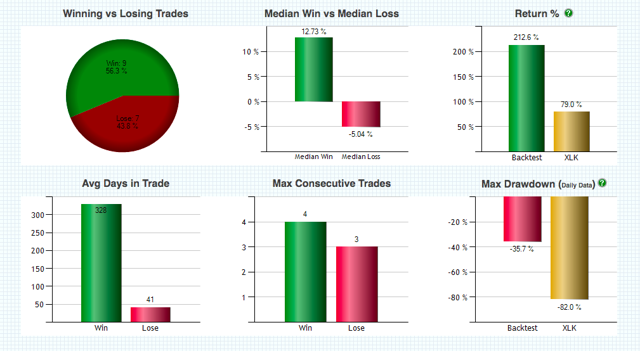
The chart shows the long-term evolution of the Technology Select Sector SPDR ETF and the 6-month price channel. The quantitative strategy buys XLK when the ETF crosses above the 75% level in the channel, and it goes to cash when it falls below 25% of such a channel.
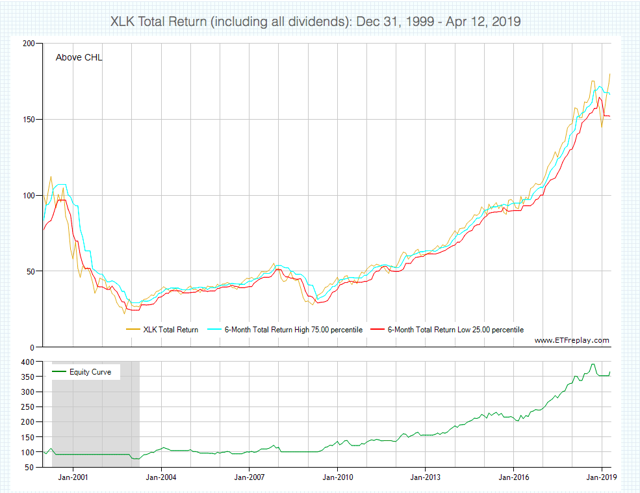
Source: ETFreplay
The backtested performance numbers are quite impressive. The quantitative strategy has produced more than triple the returns of buy and hold, with cumulative gains of 266.3% for the strategy versus 80% for buy and hold. Maximum drawdown for the strategy is 31.6% versus a maximum drawdown of 80.5% for buy and hold over the backtesting period.
Source: ETFreplay
Offering more information, the table below shows the different trades in the strategy over the backtesting period. The strategy is obviously not perfect or infallible, but it does a solid job in terms of capturing big moves and protecting portfolio capital during bear markets.
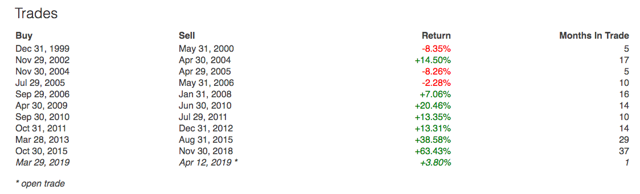
Source: ETFreplay
It's important to note that these kinds of strategies cannot be expected to outperform all the time. In fact, the strategy missed big gains in the Technology Select Sector SPDR ETF since January of 2019, since it only triggered a buy signal in March.
This is because these strategies are designed to evaluate the price action in the medium term, and it takes time for the incoming data to be reflected in the quantitative metrics. In simple terms, when markets change direction rapidly, a strategy such as this one will most probably underperform.
That limitation being acknowledged, as of the time of this writing, the medium-term trend indicators are also providing a buy signal for the Technology Select Sector SPDR ETF.
The Bottom Line
After such a strong rally in the past few months, it would not be a big surprise to observe some kind of pullback in technology stocks in the short term. However, the big picture still looks quite bullish for the sector.
When considering the amplitude of the recent rally in the Technology Select Sector SPDR ETF, as well as the trend indicators over the long term and the medium term, the rally in technology stocks looks quite healthy.
If the statistical evidence is any valid guide for the future, this bodes well in terms of potential returns for the Technology Select Sector SPDR ETF going forward.
Statistical research has proven that stocks and ETFs showing certain quantitative attributes tend to outperform the market over the long term. A subscription to The Data Driven Investor provides you access to profitable screeners and live portfolios based on these effective and time-proven return drivers. Forget about opinions and speculation, investing decisions based on cold hard quantitative data can provide you superior returns with lower risk.
Disclosure: I am long GOOG, BABA, FB, PYPL, AMZN, WDAY, CRM, ANET, MELI, NPSNY
Disclaimer: I wrote this article myself, and it expresses my own opinions. I am not receiving compensation for ...
more

