
Another Source Of Alpha Kicks In
Another Source Of Alpha Kicks In
Since June of 2017, we've been posting Portfolio Armor's top ten names each week and tracking their performance in real-time. So far, we have full 6-month performance data for 135 cohorts, and they've outperformed SPY by 0.54% annualized so far. In an article published in February, I wrote about another possible source of alpha, names that appear on my system's "cash substitute" list:
As part of our portfolio construction process, we start with equal dollar amounts of underlying securities drawn from the top names ranking, and then, to reduce hedging costs, we round down those dollar amounts to round lots (numbers of securities divisible by 100; we use round lots to reduce hedging costs). In a fine-tuning step, we then seek to minimize that leftover cash by replacing it with names from our "cash substitutes" list. These are securities that have the most negative hedging costs when hedged with an optimal, or least-expensive collar capped at the current money market rate.
A Slow Start
I mentioned in that February article that we had started tracking the unhedged performance of our top cash substitute names at the end of August 2019. They got off to a slow start, as you can see below, with the 6-month performance of the first cohort.
(Click on image to enlarge)
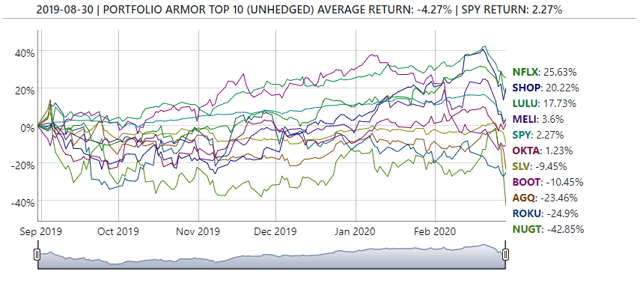
The worst performer there was Direxion Daily Gold Miners Bull 3x Shares ETF (NUGT). One thing about this screen is that it picks up leveraged ETFs (including inverse ones) occasionally. I could have put my thumb on the scale and eliminated them from the screen, but I let it ride, as I'd seen examples in the past of leveraged and inverse leveraged ETFs generate solid performance over 6-month time periods.
Performance Picks Up
As it happened, the inclusion of inverse leveraged ETFs boosted the performance of some cash substitute cohorts that finished their 6-month time frames during the Coronavirus Crash earlier this year. One example was this cohort created on October 16th, which wrapped up within about a week of the March 23rd market nadir.
(Click on image to enlarge)
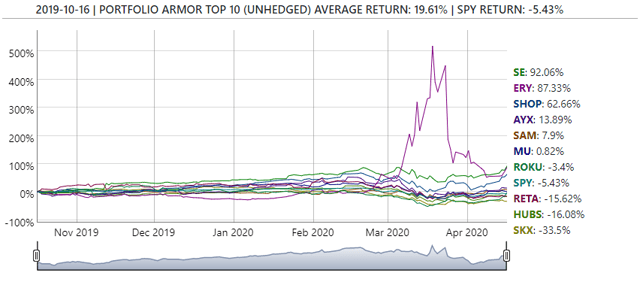
The second-best performing name there was a leveraged inverse ETF, the Direxion Daily Energy Bear 3x Shares (ERY).
If you're wondering how the cohort that finished on the market nadir itself performed, here it is:
(Click on image to enlarge)
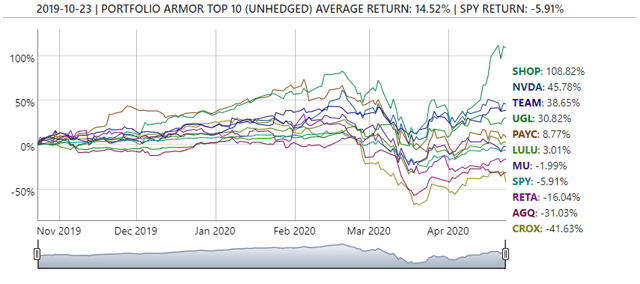
The cash substitutes lagged the market in September and the first half of October but started to outperform after that. Here's a look at the most recent cohort to wrap up its six months, the January 2nd, 2020 one:
(Click on image to enlarge)
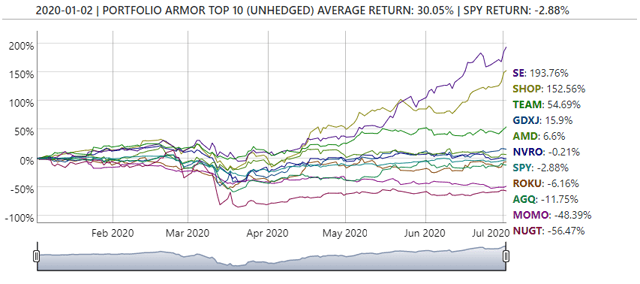
As in August, NUGT did poorly, but interestingly, the VanEck Vectors Junior Gold Miners ETF (GDXJ) posted solid performance. The runaway winners though were Sea Limited (SE), and Shopify (SHOP).
Two Poles Of Alpha
We track this kind of performance data every trading day, and starting in late May, noticed two persistent poles of outperformance: the cash substitutes, some of which are too expensive to hedge against single-digit declines with optimal, or least-expensive puts, and, in contrast, names that are so cheap to hedge with puts they can be hedged against >4% declines with them. The first group is represented below in the column with its name circled in red, and the second in the column with its name circled in blue.
(Click on image to enlarge)
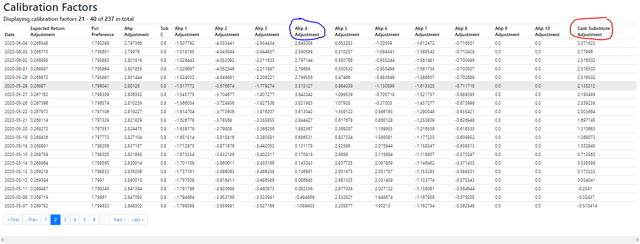
Screen capture via the author.
I highlighted the May 28th row there, because that's the date we started incorporating this data into the selection of our overall top names. As of that date, on average, cash substitutes had outperformed non-cash substitutes on our daily ranking by about 2.14%, and securities hedgeable against >4% declines with puts outperform by about 3.52%, as you can see in the highlighted row above.
Using This Data
We use this data by boosting the names hedgeable against >4% declines with puts and cash substitutes up on our overall daily top names ranking, commensurate with their aggregate outperformance. So, as of May 28th, these were our top ten names.
(Click on image to enlarge)
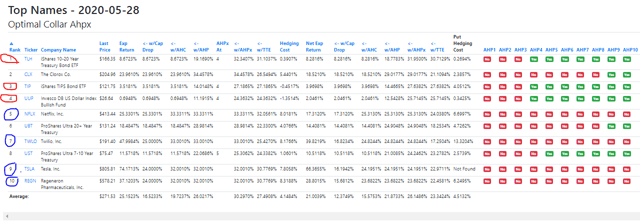
Screen capture via the author.
The names with their numbers circled in red, the iShares 10-20 Year Treasury Bond ETF (TLH), the iShares TIPS Bond ETF (TIP), and the Invesco DB US Dollar Index Bullish Fund (UUP), were the ones hedgeable against >4% declines, and the ones with their numbers circled in blue, Netflix (NFLX), Twilio (TWLO), Tesla (TSLA), and Regeneron (REGN) were the cash substitutes.
Preliminary Performance
Here's how that May 28th top names cohort has performed so far, versus SPY:
(Click on image to enlarge)
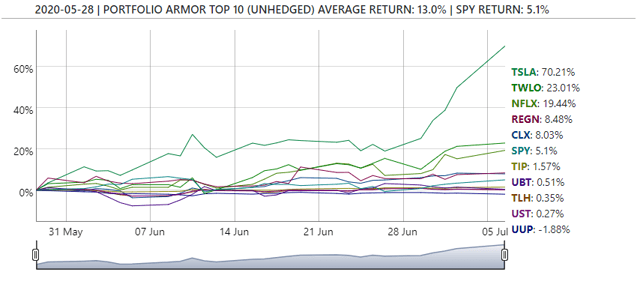
As you can see, the outperformance here was driven largely by the cash substitutes, with TSLA and TWLO leading the way.
Wrapping Up
We tweak our security selection method every day the market's open, as new data comes in. As of July 6th, the system is now giving greater preference to cash substitutes than securities hedgeable against >4% declines with puts, as that's what the data indicates. As always, we'll go by the data.


