
Above The 40 – The Stock Market Cascades Down To Oversold Territory
AT40 = 16.7% of stocks are trading above their respective 40-day moving averages (DMAs) (a drop of 14.2 percentage points to an 8-month low and the first day of an oversold period)
AT200 = 38.6% of stocks are trading above their respective 200DMAs (a drop of 7.6 percentage points to a 6-month low)
VIX = 23.0 (an increase of 44.0%)
Short-term Trading Call: bullish (change from neutral)
Commentary
Sellers dominated the trading action in a way that we have not seen in a long time…
- The S&P 500 (SPY) dropped 3.3%, its largest single-day loss since early February.
- The NASDAQ dropped 4.1%, its largest single-day loss since June 24, 2016.
- The volatility index, the VIX, soared 43.9%, its 11th largest gain ever. The last time the VIX gained more in a single day was the record-setting 115.6% gain on February 5, 2018.
Roll out the bull, the lower prices are here and fear has finally steamrolled complacency.
In my last Above the 40 post that covered Friday’s trading action, I wrote: “So while the shorter-term indicator is at levels that have frequently marked bottoms in this bull market, the longer-term indicator is not yet creating the kind of breakdowns that overwhelm bulls with bargain signs.” The indicators are flashing bargains now. AT40 (T2108), the percentage of stocks trading above their respective 40-day moving averages (DMAs), plunged sharply from 30.9% all the way to 16.7%. AT40 indicates the market is oversold (below 20%), and my favorite indicator has not been this low in 8 months.
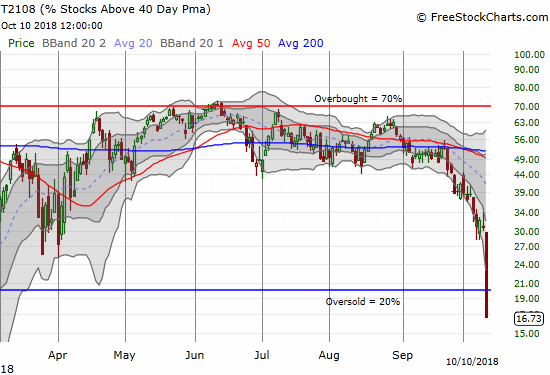
AT40 (T2108) experienced its sharpest downdraft since the February swoon. At 16.7% AT40 went from “close to oversold” to definitively oversold!
AT200 (T2107), the percentage of stocks trading above their respective 200DMAs, plunged alongside AT40. AT200 dropped from 46.2% to 38.6%, a level unseen for 6 months. Suddenly, investors are looking at a BROAD swath of stocks that have broken down below their long-term (up)trends.
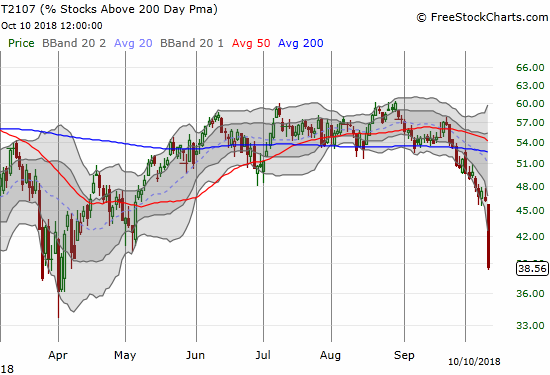
AT200 (T2107) experienced its sharpest downdraft since April. At 38.6% AT200 definitively shows a market experiencing a broad-based breakdown.
These extremes immediately give me a bias for buying. I flipped the short-term trading call from neutral to bullish. I closed out almost all my bearish positions (hedges). I started my transition to bullishness by buying put options on ProShares Ultra VIX Short-Term Futures (UVXY). The VIX’s surge is an extreme that history says cannot be sustained for long. At 20, the VIX traditionally indicates an elevated level of fear. From this point and higher, sellers exhaust themselves relatively quickly. I like starting with a volatility fade because it can still pay off even after more substantial gains from the VIX. The inevitable collapse in volatility is typically sharp enough to cause substantial losses in the long volatility products. I chose expiration dates for the end of next week to give an initial first runway to this potential action.
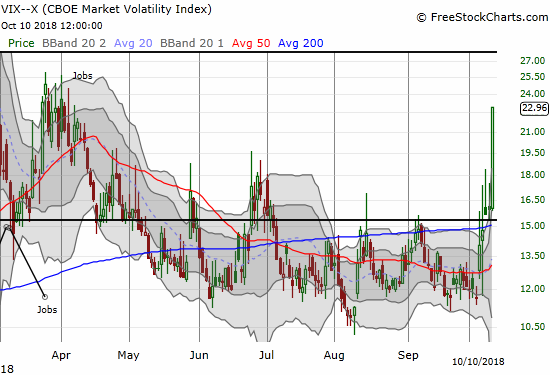
The volatility index, the VIX, has returned to levels last seen in the waning days of the last big market sell-off.
The major indices are all over the place with a mix of bearish breakdowns and lingering hopes for critical support to hold. This downward cascade of selling and breakdowns means that the selling can continue for another day or two before a relief rally off the oversold extremes ensues. In particular, the S&P 500 has not yet quite tested 200DMA support. The index last touched this critical long-term support in May and only closed below its 200DMA ONCE during the sell-off earlier this year. Before that episode, the index last tested support during the election related swoon in November, 2016 and last closed below the 200DMA in June, 2016. In other words, traders and investors alike should be watching the coming showdown with the 200DMA very closely. I was amazed to see the important 2800 level give way so easily, especially with the S&P 500 already so far below its lower Bollinger Band (BB). The index is extremely extended to the downside here. Ditto for the tech-laden indices and small caps.
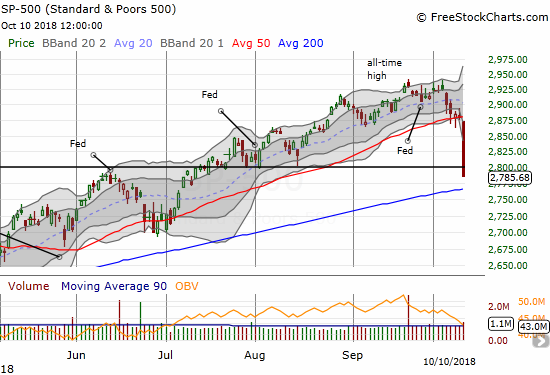
The S&P 500 (SPY) dropped 3.3% in a path that took it all the way from 50DMA support to within less than 1% of 200DMA support.
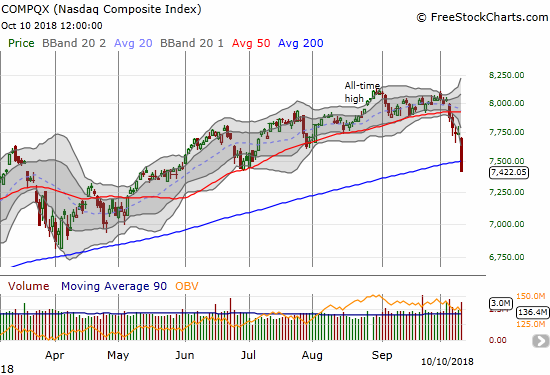
The NASDAQ confirmed its 50DMA breakdown with a bearish 200DMA breakdown. The NASDAQ last traded below its 200DMA in July, 2016!
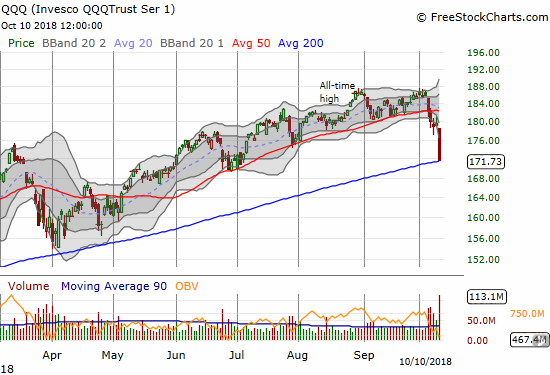
The Invesco QQQ Trust (QQQ) lost 4.4% and closed right on top of its 200DMA in a move reminiscent of its picture-perfect close on top of 50DMA support 4 trading days ago.
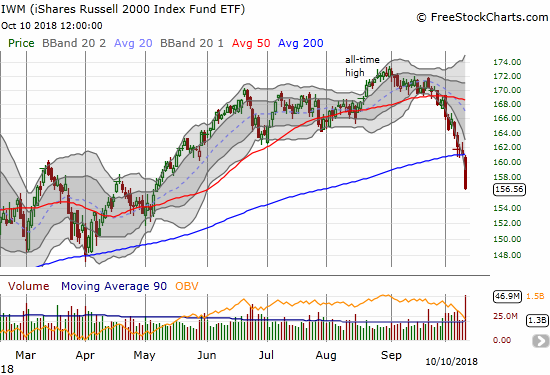
The iShares Russell 2000 ETF (IWM) confirmed its bearishly precipitous slide with a 2.9% loss and 200DMA breakdown.
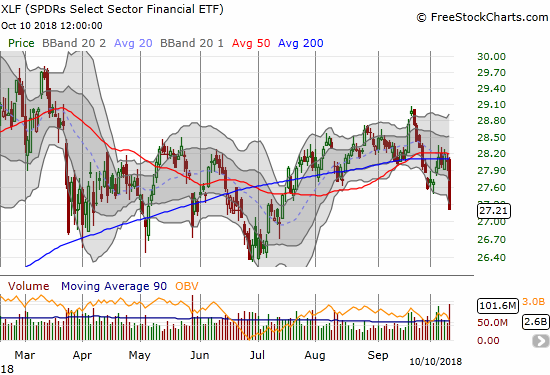
The Financial Select Sector SPDR ETF (XLF) lost 2.9% in a move that confirmed 50/200DMA resistance.

The SPDR S&P Retail ETF (XRT) lost 2.5% with a 200DMA breakdown that confirmed the end of the rally in retail stocks.
A washout of sellers is a great way to resolve oversold conditions, but such a cataclysmic end seems so regularly elusive. A gap down at the open would generate the right amount of panic to force out even the most reluctant sellers. A gap down would put the major indices at an unsustainable extreme below lower Bollinger Bands except in the case of massive successive waves of selling characteristic of a bear market. However, instead of a gap down what often happens in these cases is that the follow-on selling in international markets somehow satisfies the selling urges in the U.S.; buyers eagerly jump into the market right before the open. On the flip side, a gap UP would leave a lot of motivated sellers awaiting higher prices to unload their burdens. In any case, the 200DMA breakdowns in the major indices provide good tells of the potential limits (resistance) of the first relief rally.
Per the AT40 oversold trading strategy, I will get more aggressively bullish the lower AT40 goes. Additional extreme upward changes in volatility enhance that aggressiveness. With earnings season presenting a lot of stock-specific risk, I will mainly focus on the major indices for buys. The less aggressive strategy features waiting for the first sharp pullback in volatility while AT40 is oversold or to wait until AT40 ends its oversold period. Always note that an oversold market can get more oversold and the end of one oversold period can lead to a new one. In a bull market, supports hold and oversold periods are short-lived. The February swoon started with a 1-day oversold period followed by a 4-day oversold period. Three weeks later, AT40 dropped close to the 20% level before bouncing never to return until now.
President Trump added some additional drama to the sell-off as he took the bait of a reporter asking about his thoughts on the market sell-off. Trump took the opportunity to once again go after the Federal Reserve. He left the impression that the Fed is at fault for the market’s latest bout of weakness because of its current campaign of rate hikes. Trump even went so far to say that “the Fed has gone crazy.” Of course, this description is not surprising coming from Trump, but it is VERY surprising coming from a U.S. President. As if that was not strange and surprising enough, Trump went on to reassure the audience that the market correction is “good” and it’s “the correction we’ve been waiting for for a long time.” I would have never guessed a U.S. President could eagerly await a market correction caused by what he thinks is poor Fed monetary policy.
This short clip of candidate Trump provides important context to Trump’s current depictions of the Fed. Two years ago, candidate Trump was complaining that the Fed was holding interest rates too low for political reasons…and that was when the economy was not running nearly as hot as it is running now.
I enjoyed reading and listening to many of the narratives swirling around to explain the market’s sell-off. Few, if any, are useful because they all have to do with data and information we have known for quite some time, including the Fed’s slow and steady rate hikes. The main difference now is that the market suddenly cares about the negatives and the headwinds. Most importantly, the current sell-off reminds us that poor (and shrinking) breadth during a strong run-up is a sign of underlying weakness. I saw a number of pundits claim that breadth was fine and/or that a narrow market did not matter given strong economic fundamentals and corporate earnings.
The truly new catalysts will come with the stories companies tell about earnings as the season kicks off in earnest in a day or two. I have already noted two companies that sent up important warning signs: Acuity Brands (AYI) and PPG Industries (PPG). Fluor (FLR) provided more bad economic news in the after hours session.
CHART REVIEWS
There are of course A LOT of charts I could post that well describe the carnage and the opportunity in the market. The following charts can only scratch the topmost surface. I highly recommend checking out SwingTradeBot for a method of going through a large number of chart scans for different set-ups.
Amazon.com
It looks like a lasting top is in for AMZN. The current technical damage confirms a double-top. Buyers have a LOT of work ahead to repair the carnage and re-establish upward momentum. I now expect AMZN to retest its 200DMA before its next sustained rally. Even then, the 50DMA is likely to hold firm as resistance.
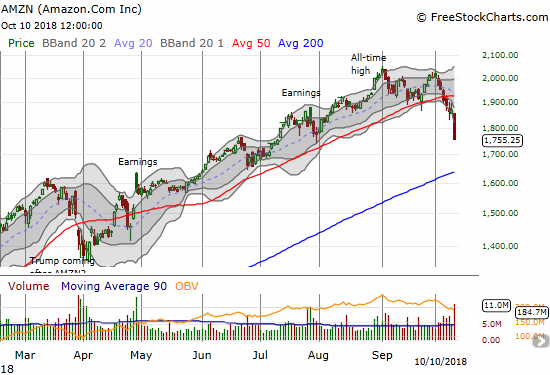
Amazon.com looks like it has confirmed a double-top with a massive confirmation of its 50DMA breakdown (a whopping 6.2% loss on the day!)
Cloudera and Hortonworks
It was a sure sign of the market’s unapologetic bullishness when HDP announced an acquisition of CLDR and both stocks soared over 20%. The sellers went to work right after the initial gap up. Four straight days of selling later have reversed the gap up and caused additional technical damage.
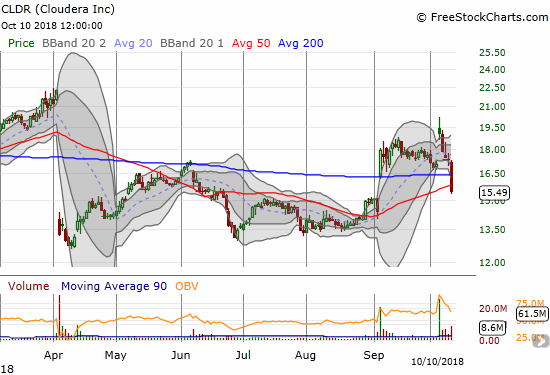
Cloudera lost another 10.8% in a move that broke through 50 and 200DMA supports.
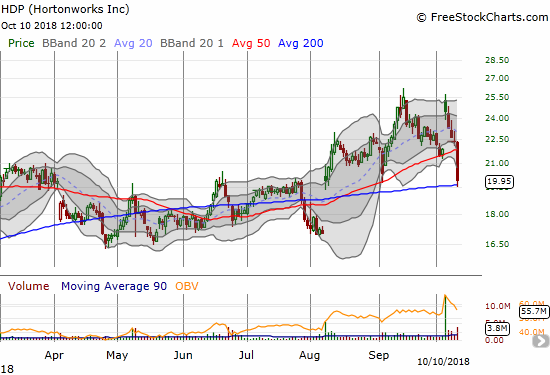
Hortonworks (HDP) dropped 10.9% and broke through 50DMA support. The 200DMA held as support in picture-perfect form.
Electronic Arts
I used the current pullback to finally go for the risk reversal options trade in EA. However, today’s selling put EA at imminent risk of retesting $100.
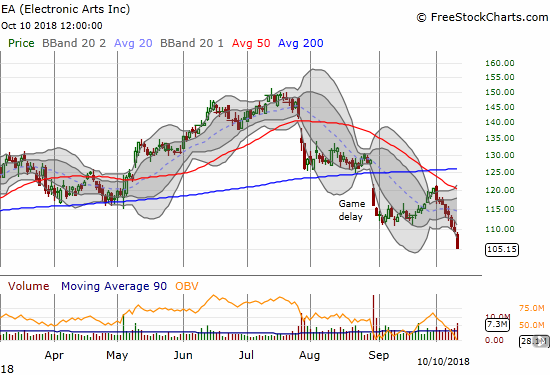
Electronic Arts lost 4.0% as it just barely closed at a new low for the year.
iShares MSCI Brazil Capped ETF
I am glad I decided to wait on taking profits in EWZ. The market liked the results of Brazil’s presidential election and sent EWZ gapping up over its 200DMA resistance. I sold the next day. I may have exited just in time…
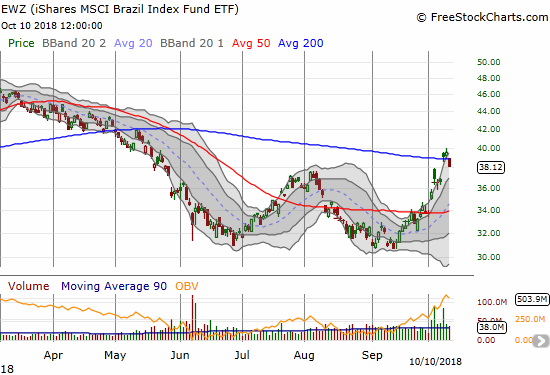
The iShares MSCI Brazil Capped ETF lost 3.7% and dropped back below its 200DMA.
PPG Industries
An activist investor loaded up on PPG shares before the earnings warning. That news was enough to give PPG some brief relief. I will continue to watch PPG closely for signs of a bottoming process.
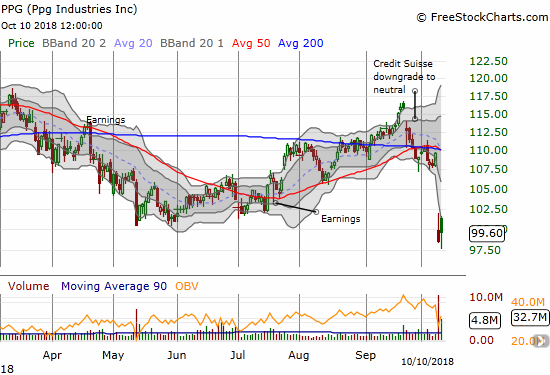
Sellers quickly faded an initial rally by PPG Industries. The stock closed below its lower Bollinger Band (BB) again but avoided a new closing low.
Red Hat
I am glad I decided to sell RHT on a break of important support. RHT is symbolic of the on-going carnage in former high-flying tech stocks.
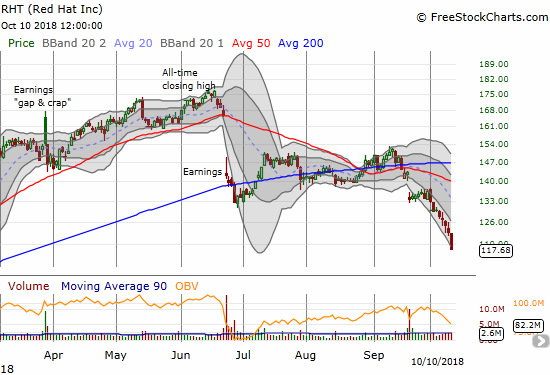
Sellers have pressed the accelerator on Red Hat. The stock lost another 4.1% and closed at a 52-week low.
Splunk
On Tuesday, I speculated on SPLK holding onto 200DMA support as an early “oversold” play. SPLK went on to decisively break through that support for the first time in over a year. A break below the double support from June and July would confirm the 200DMA breakdown and put SPLK in bearish territory.
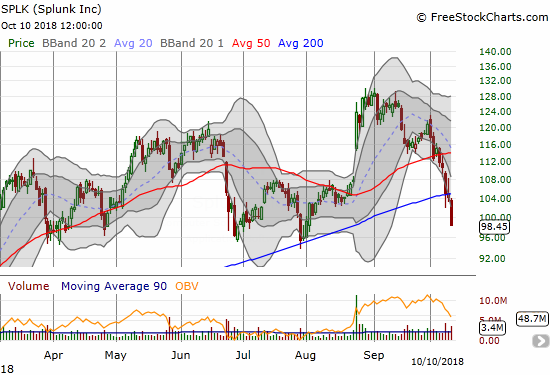
Splunk broke down below its 200DMA for the first time since last summer. The 5.5% loss only set a 2-month low.
Zillow Group
My long Redfin (RDFN), short ZillowGroup (Z) pairs trade worked out well again. I took profits on my Z put options as the stock hit around $37. Unlike the last round, RDFN is not likely to offer salvage value on the call options. RDFN lost 4.8% and closed at a new all-time low.
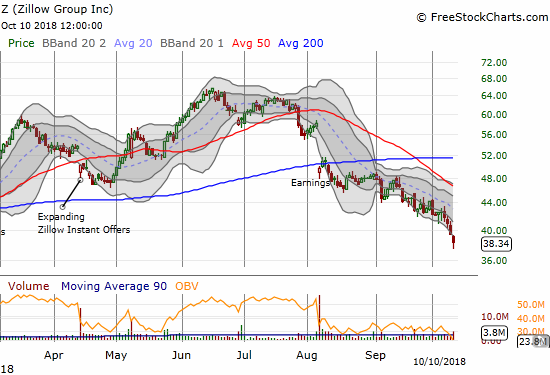
Zillow (Z) bounced off its intraday low but still lost 2.8% and closed at a new 13-month low.
Active AT40 (T2108) periods: Day #1 under 20% (oversold ending 161 trading days above 20% and 130 days above 30%), Day #1 under 30%, Day #8 under 40%, Day #13 under 50%, Day #29 under 60%, Day #82 under 70%
Daily AT40 (T2108)

Black line: AT40 (T2108) (% measured on the right)
Red line: Overbought threshold (70%); Blue line: Oversold threshold (20%)
Weekly AT40 (T2108)

*
All charts created using freestockcharts.com unless otherwise stated
The charts above are my LATEST updates independent of the date of this given AT40 post. For my latest AT40 post click here.
Disclosure: long UVXY puts, long SPLK calls, long EA call and short EA put, long RDFN calls
Follow Dr. Duru’s commentary on financial markets via more


