A New Short-Term Downtrend Began
The Short-Term Trend
I believe a new short-term downtrend began on Friday, March 19. The PMO stalled out this past week below the top of its range, and it has now turned lower. There was a similar period of weakness in January which whipsawed the PMO, so I'm keeping in mind that a whipsaw could happen again.
Higher yields have been pushing investors to sell technology and to buy financials and cyclicals, but it is starting to look like the financials and cyclicals are extended and may need some time to consolidate gains. So if yields continue to rise, it may be prove that there aren't many areas of the market available to buy.
For the first time since February 2020, my trading account is all cash and my longer-term accounts are 50% cash. I want the cash because I am not sure how to invest the money, but also because I know that my best gains almost always occur when I have cash available to invest after the market has pulled back.
If I am wrong, and the market finds its footing to move higher, I'll quickly admit to my mistake and jump back in. I think this strategy allows me to respect the market and its risks.
One of the requirements for a new downtrend is to see the SPX below its five-day average. In this case, all the major indexes are now trading below their five-day averages.
The bullish percents are rolling over.
The Summation Index is also rolling over.
The PMO of the broad market has turned lower, but it isn't a convincing short-term sell signal yet. Also, it shows a clear pattern of weakening longer-term momentum. The good news is that after one or two more thrusts lower, the momentum indicator will be nearer to a more powerful lift-off level similar to November 2020.
I think this the most important chart of the day. While the PMO is near the top of its range, the number of NASDAQ new 52-week lows has been increasing and is now at a level that indicates the potential for another significant pull back. The last thing you want to see is the market near a short-term peak while there are also quite a few new 52-week lows.
The NDX has been weak, but the broader market was able to advance on the strength of the NYSE stocks. But that can only last for so long, and I think it is probably too early to be buying back into the NASDAQ stocks.
Here is a chart style I copied from John Murphy years ago, and it shows that the Dow stocks may have peaked short-term.
The 10-day call/put ratio is usually one of my favorite indicators, but it hasn't been as useful lately. It seems out-of-sync with the other charts, maybe because bullishness became so frothy since November? Anyway, I include this chart to point out that not all the indicators agree with my view that we have established a short-term top in the market.
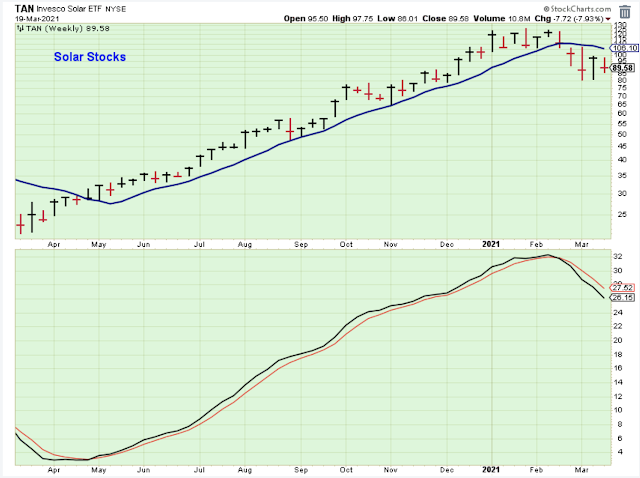
I was a big fan of the solar stocks. This was a really good run. Now they are consolidating and I'm watching this chart for the next opportunity to jump back in.
My favorite industry is shown below, but similar to the solar stocks, the semis are resting for a bit.
Another favorite industry is shown below. It seems as though these stocks anticipated rising yields well in advance. Now I wonder if the stocks are gaining some strength and that it indicates the rise in yields has only a few more months before it peaks? I am starting to like these stocks again.
Rising yields, lower bond prices -- will bonds break below this support? My guess is that yes, this ETF will break down, but that will be the signal to start to buy beaten down stocks again. This is just a guess, though.
Sentiment is still way too high from a contrarian point-of-view.
A friend of mine sent me a note that mentioned his best trades have always been high-risk, high-opportunity stocks. It made me think about what my best trades have been and I replied that I don't do well with high risk trades, and that my biggest winners have always been stocks purchased at the end of major selloffs in which I moved to cash early in the downtrend.
I think the key for me in those situations was that I moved to cash early in the downtrend, so I had the confidence in myself at the bottom of the downtrend to know when to re-deploy the cash.
Outlook Summary
- The short-term trend is down for stock prices as of March 19.
- Contrarian sentiment is unfavorable for stock prices as of Nov. 14.
- The economy is in expansion as of Sept. 19.
- The medium-term trend for treasury bonds is down as of Oct. 10 (prices lower, yields higher).
Disclaimer: I am not a registered investment adviser. My comments reflect my view of the market, and what I am doing with my accounts. The analysis is not a recommendation to buy, sell, ...
more


