
A Make Or Break FOMC…

Summary: The primary trend in equities remainsup. The short-to-intermeditate term picture dramatically improved (big reversals in internals, liquidity, and breadth) over the past two weeks due to the shift in Fed communications, which raised the odds of a Dec cut to roughly 90%. This makes this week’s FOMC a make or break meeting. Transports have broken out from a strong pattern, while long bonds have broken down. The US dollar is at a key level, and natural gas plays are starting to gain momentum…
1. Our Trifecta Lens Indicator, a composite of technicals, breadth, internals, sentiment/positioning, and liquidity, jumped to +1 for the first time since Oct of 24’, signaling a bullish shift in market character. This means we want to be looking for opportunities to add here. The iShares US Transports ETF (IYT) offers one such opportunity as it completed a cup-n-handle pattern this past week.
![]()
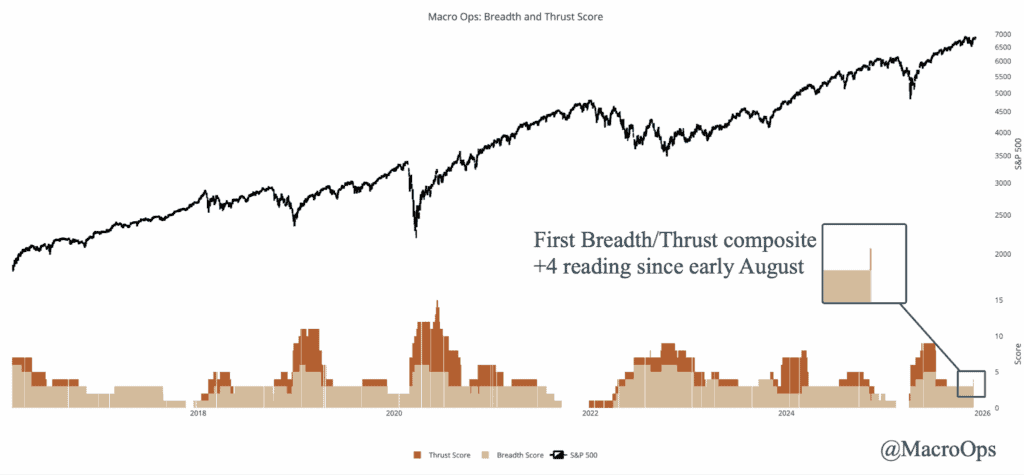
2. Our Breadth and Thrust composite indicator climbed to +4 last week for the first time since early August, on the back of both improving breadth as well as a few thrust signals.
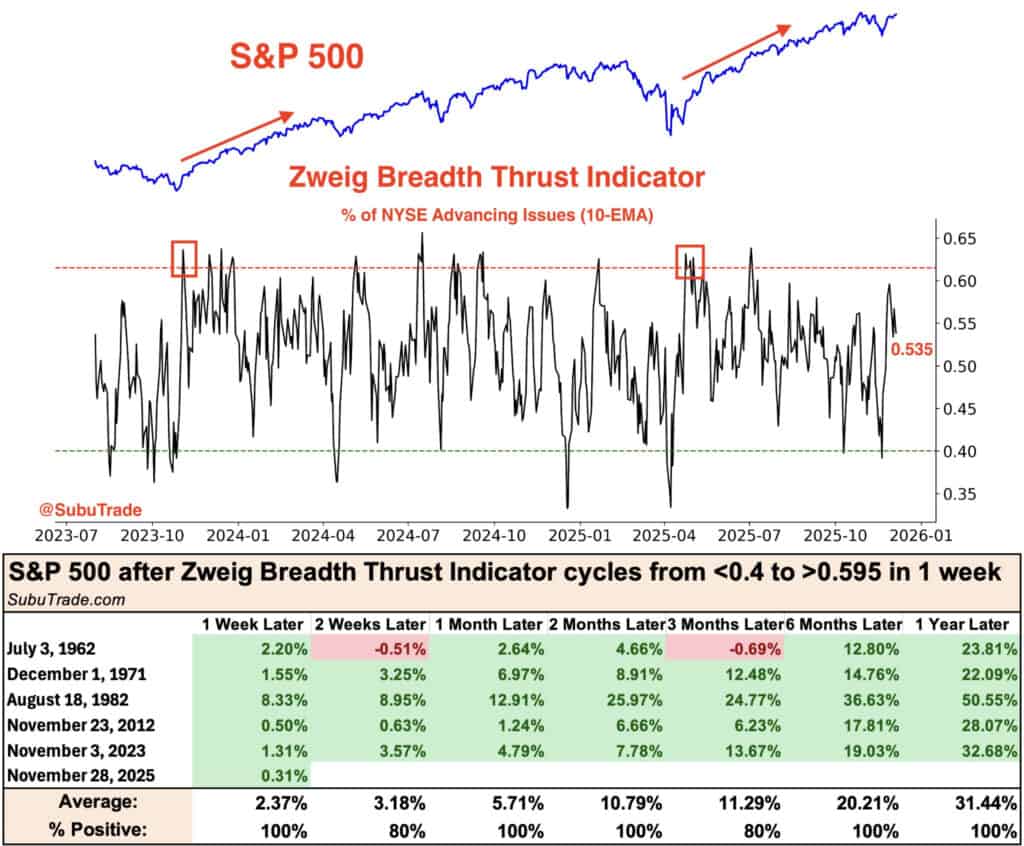
3. A Zweig breadth thrust almost triggered last week but fell a bit short of what’s required for a standard signal.
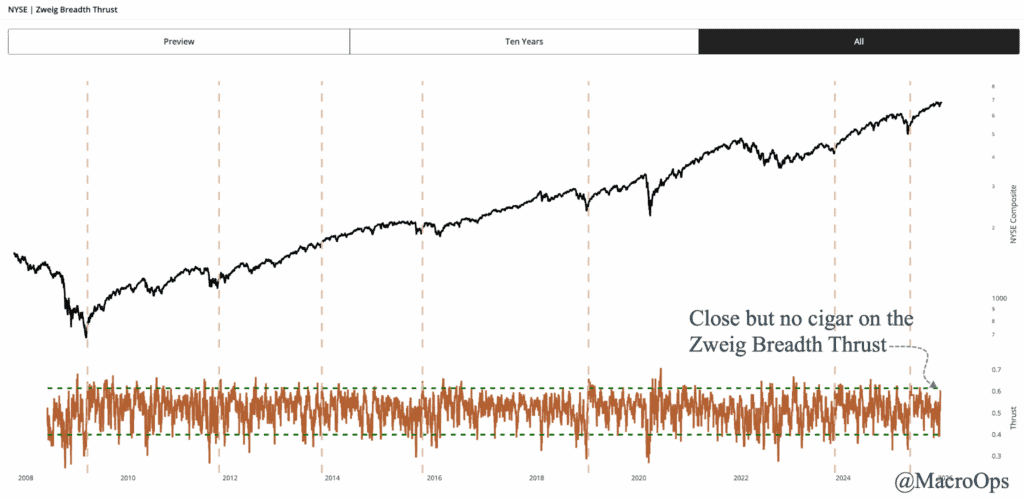
4. However, as @Subutrade points out, a near miss from the Zweig signal also tends to see strong forward returns in the market.
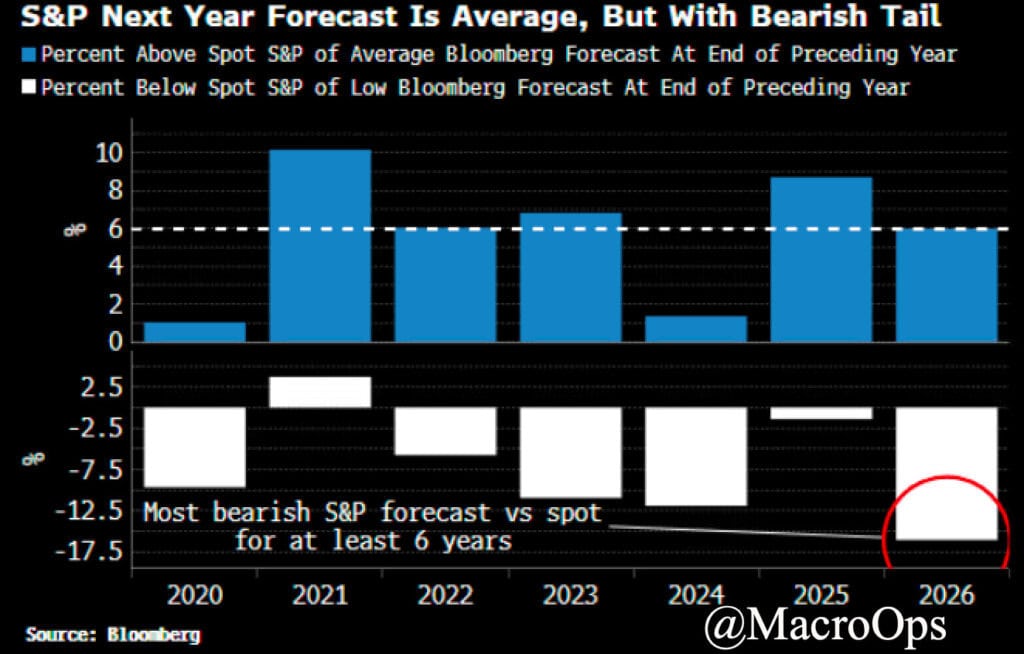
5. I thought this was interesting… BBG’s Simon White notes that while the S&P’s forecast average is inline with its historical average, forecasters also had their most bearish forecast skew in at least six years. This bearish bent is a good thing for 26’.
6. Also from Simon, this chart shows the aggregate inflows into commodity ETFs (blue line) and how surges in inflows tends to lead CPI (white).
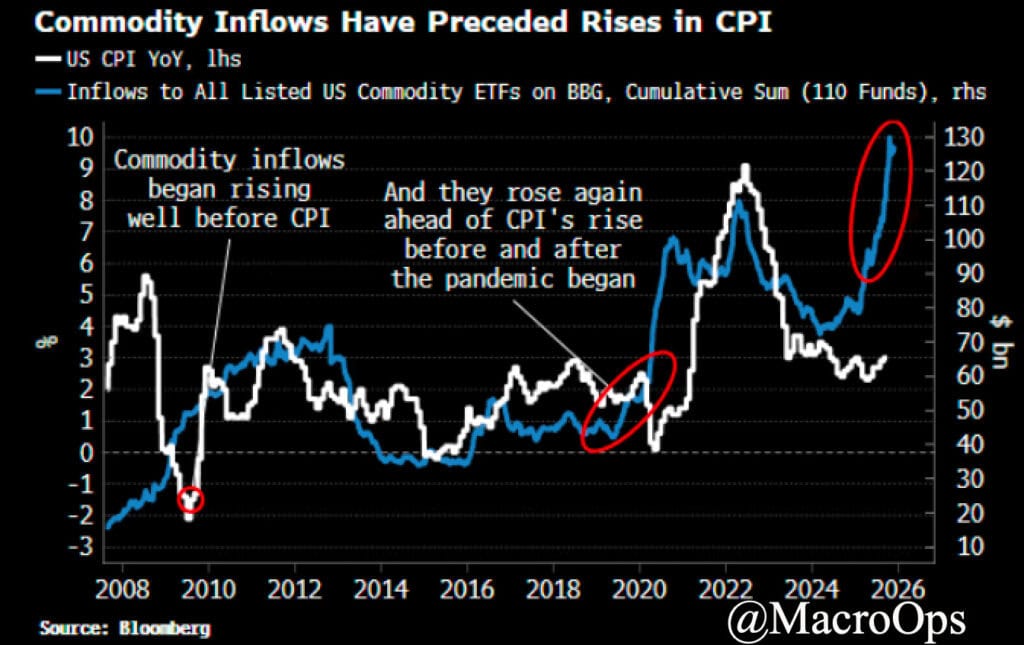
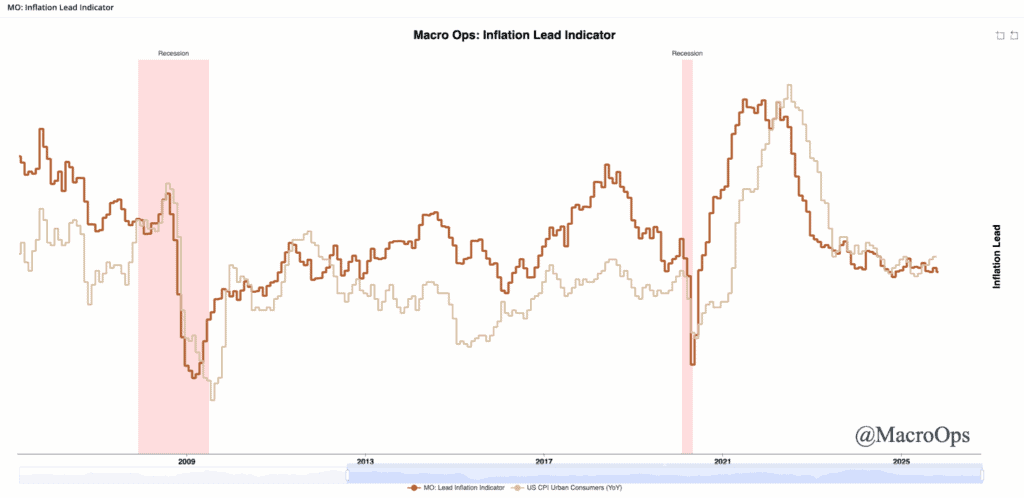
7. While we think a pickup in inflation next year is quite likely — especially if Hassett becomes Fed chair — we’re not seeing it in our inflation lead (amber line) and don’t see inflation becoming a problem until the second half of 2026.
(Click on image to enlarge)
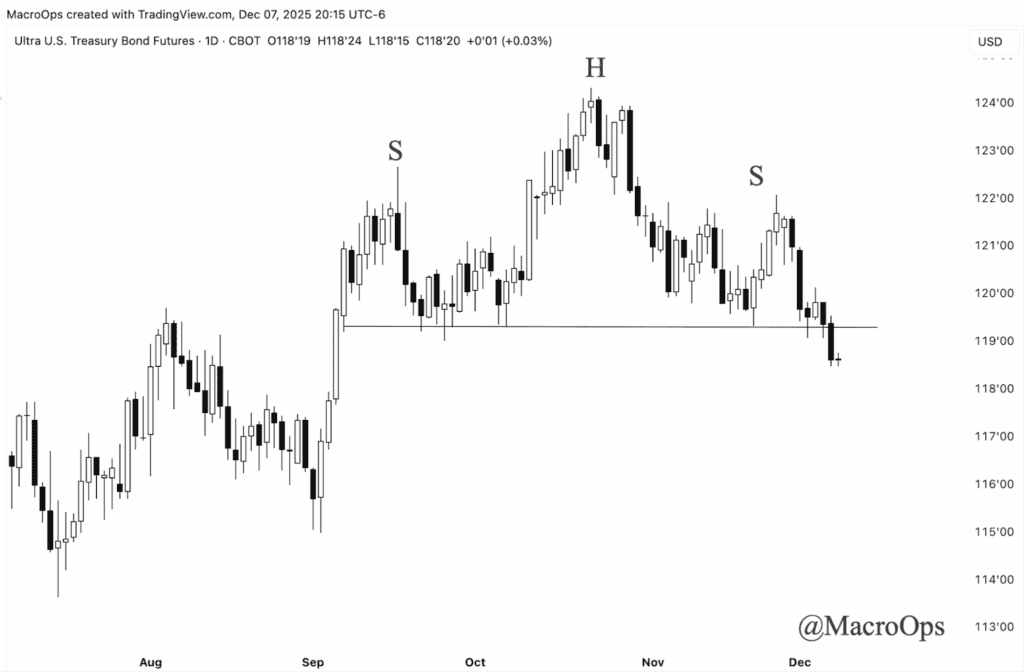
8. With the Fed cutting into a reflationary economic backdrop, we should expect to see the curve steepen. Long bonds completed a H&S top last week. This is within a larger multi-year compression regime, that we’ve been talking about for a few months now. With commodities breaking out to the upside, we expect this trend in the long end to accelerate to the downside over the coming months.
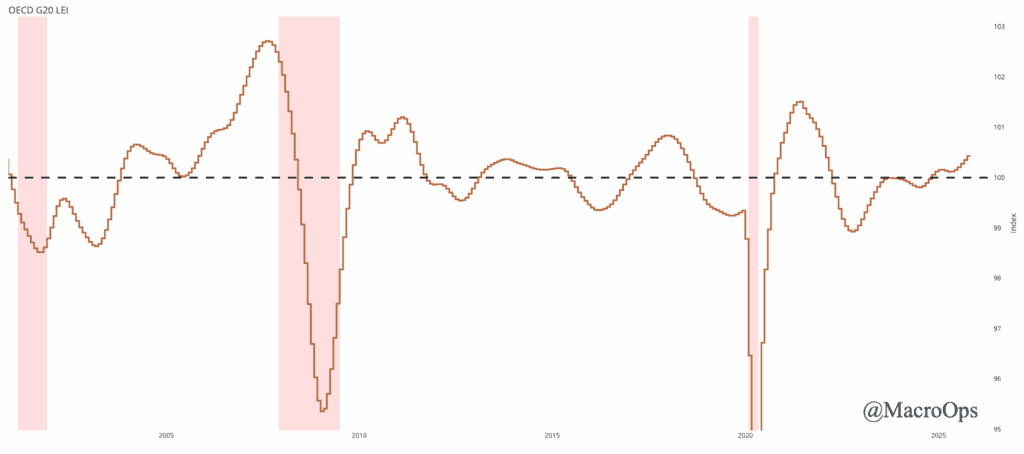
9. The OECD G20 Composite Leading Indicator has risen to its highest level since February 2022.
(Click on image to enlarge)
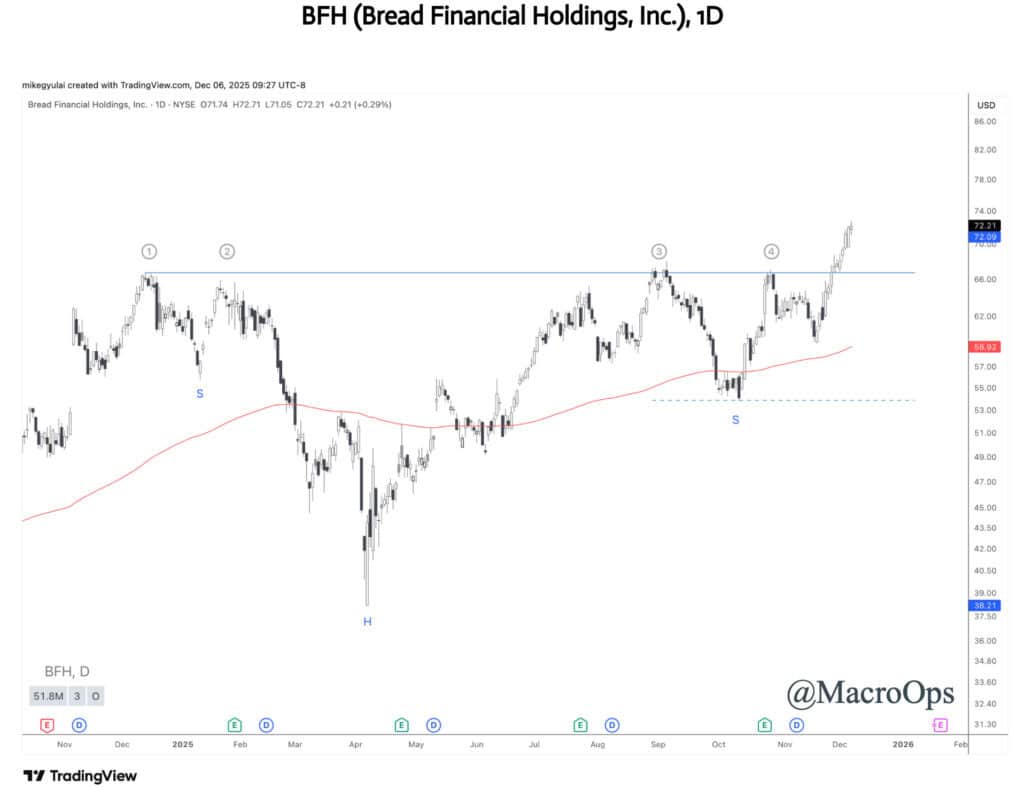
10. Our newest team member and classical charting expert, @mikegyulai, covered the budding setups within the financial sector in his latest weekly report, highlighting BFH as a leader amongst the group.
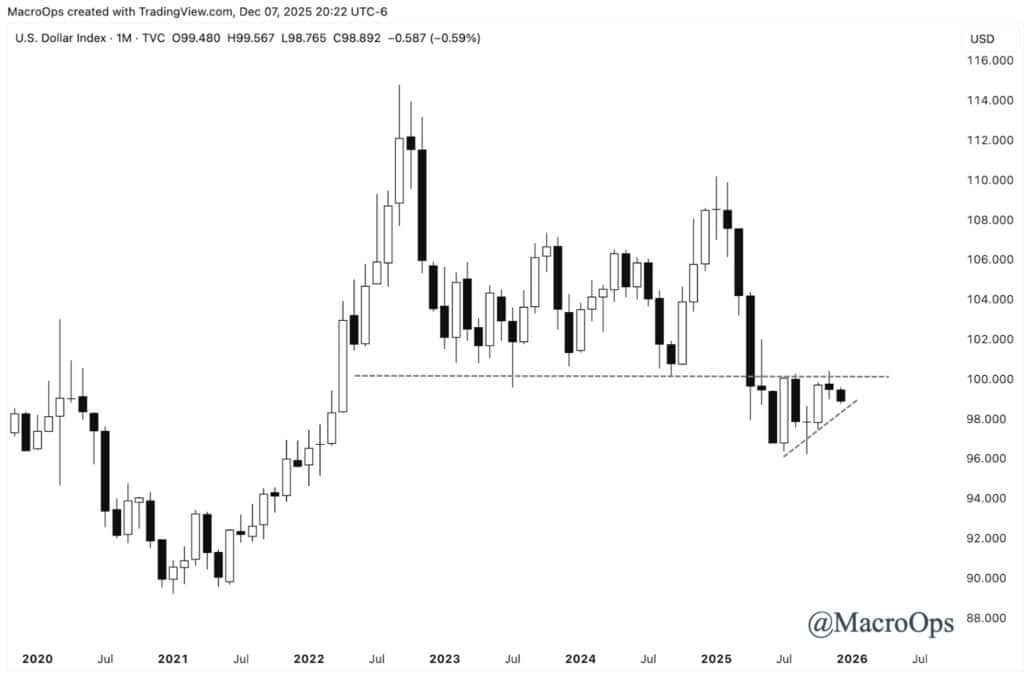
11. I’m tracking the dollar for a potential short entry. It’s coiling against the underside of a major resistance level. CTAs have turned lazily long and Trump is expected to announce Hassett as the new Fed chair any day.
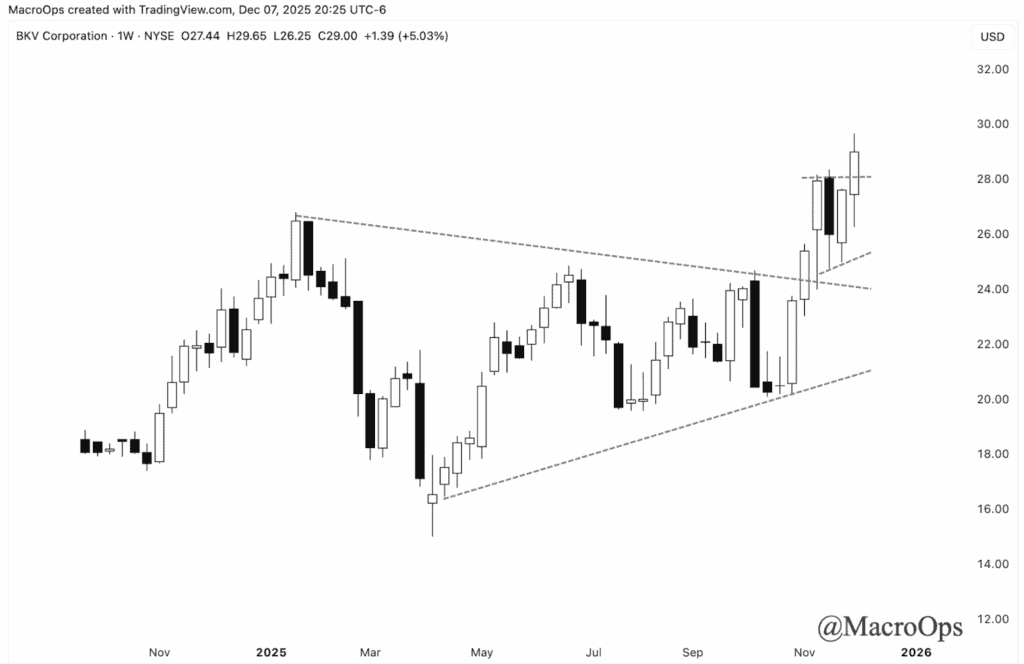
12. Natty is finally waking up. There are a number of names I like to play this (CKR, AR) and I’m adding BKV to this list (chart below is a weekly).
More By This Author:
The Last Few Weeks Have Been Brutal
Bad Regime Dynamics…
Some Thoughts On Nvidia Earnings & Cash Flow Variance
Disclaimer: All statements are solely opinions and are for educational purposes only.


