
A Bullish Signal For SPDR S&P 500
The widely followed SPDR S&P 500 (SPY) is caught between cross-currents nowadays. On one hand, massive monetary stimulus from the Fed and solid earnings from the mega-cap leaders are providing a tailwind for prices. On the other, valuations are quite stretched, and there is a lot of uncertainty on the political and economic front in the near term.
Trying to figure out how these factors will play out and what kind of impact they will have on SPY is practically impossible to do. In fact, investors should stay away from these kinds of forecasts. As opposed to trying to predict what prices will do next, it is much more effective to measure what prices are doing now and adapt to changing conditions over time.
Martin Zweig, one of the most successful investors ever alive, said it quite clearly:
I measure what's going on, and I adapt to it. I try to get my ego out of the way. The market is smarter than I am so I bend.
Don't Bet Against The American Consumer
Consumer spending accounts for nearly 70% of US GDP, so the consumer sector is a critical driver for the economy and the stock market. Watching the consumer can tell you a lot about the kind of environment that you are facing.
But economic indicators are mostly lagging data. If we take a look at SPY versus retail sales, it is easy to see that prices generally anticipate the evolution of the economic indicators. SPY started declining before the contraction in retail sales was visible in the economic data in late February, and it also started recovering in anticipation of better economic indicators on the way up.
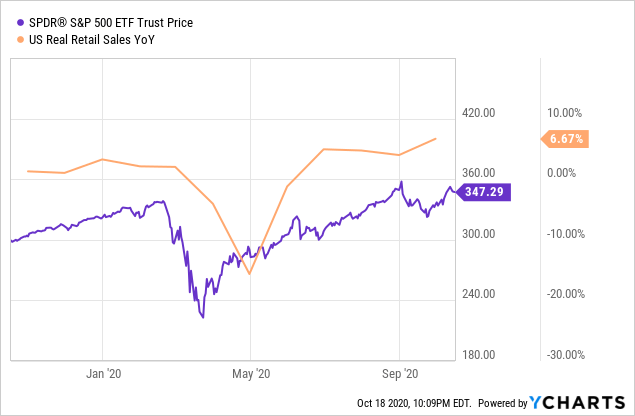
Data by YCharts
The stock market is a forward-looking mechanism, it is not always right, but following the price trends is much more effective than trying to predict how the economic indicators will evolve. If the consumer sector is crucial for the economy and market prices generally anticipate economic indicators, it makes sense to manage risk exposure in SPY by following the signals from the consumer sector.
The Consumer Trend Model is a quantitative strategy that trades in and out of SPY based on the price signals from the consumer discretionary and consumer staples sectors. The main idea is that consumer discretionary and consumer staples are remarkably different sectors with dissimilar behavior.
Consumer discretionary products and services are considered non-essential, but desirable when we have enough money to buy them. Typical examples include restaurants, fashion, and home improvement products.
The table shows the top 10 positions in the Invesco S&P 500 Equal Weight Consumer Discretionary ETF (RCD). These kinds of companies generally benefit from improving appetite for consumption in the economy.
(Click on image to enlarge)
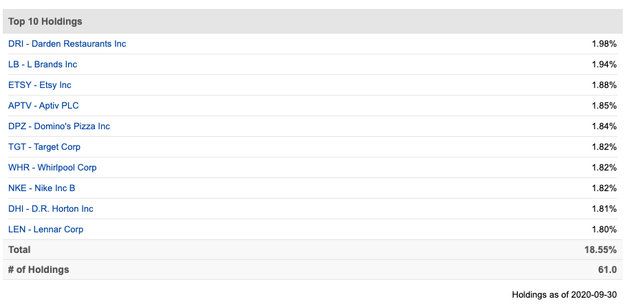
Source: Seeking Alpha
In stark contrast, the consumer staples sector is mostly focused on essential items such as food, beverages, tobacco, and household products. Most people are unable or unwilling to reduce spending on consumer staples sectors, even under tough economic conditions.
The top 10 positions in Invesco S&P 500 Equal Weight Consumer Staples ETF (RHS) paint a very clear picture. These are mostly defensive companies, and they tend to outperform the market in times when consumers are buying solely what they truly need as opposed to what they want.
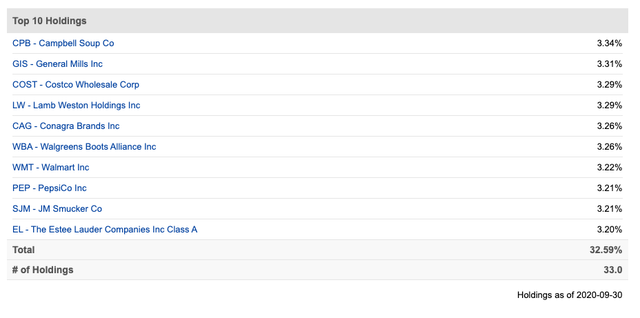
Source: Seeking Alpha
In simple terms, when consumer discretionary stocks are outperforming consumer staples stocks, this generally means that optimism is increasing and risk appetite is on the rise. It doesn't mean that the economy is necessarily doing well, but it is the direction of the trend that really matters. When more money is being allocated to consumer discretionary than to consumer staples stocks, this is bullish for stocks in general.
Listening To The Consumer
The main idea behind the Consumer Trend Model is quite simple, we can manage risk in SPDR S&P 500 by reading the data from the consumer discretionary and consumer staples sector.
When the Invesco S&P 500 Equal Weight Consumer Discretionary ETF [RCD] is outperforming Invesco S&P 500 Equal Weight Consumer Staples ETF [RHS], we assume more risk by investing in SPY, and when RCD is underperforming RHS, we position the portfolio for safety by investing in Treasury bonds via iShares 7-10 Year Treasury Bond ETF (IEF).
A previous version of this model was using the traditional market capitalization-weighted ETFs to generate the signals: Consumer Discretionary Select Sector SPDR ETF (XLY) and Consumer Staples Select Sector SPDR ETF (XLP). This version produced higher backtested returns, but Amazon (AMZN) currently accounts for 23% of XLY, so the returns from one single company can distort the signals from the model. It is reasonable to settle for smaller backtested returns in order to keep the model more faithful to its logic.
Back to the Consumer Trend Model, in order to measure the performance of RCD versus RHS, we can build a relative performance ratio between the two ETFs. The ratio is the yellow line in the chart below, and the 100-day moving average in such a ratio is the black line.
When the ratio is above the 100 days moving average, we can say that consumer discretionary stocks are outperforming consumer staples stocks, so the portfolio is allocated to SPY. Alternatively, when the ratio is below the 100 days moving average, the portfolio is invested in IEF.
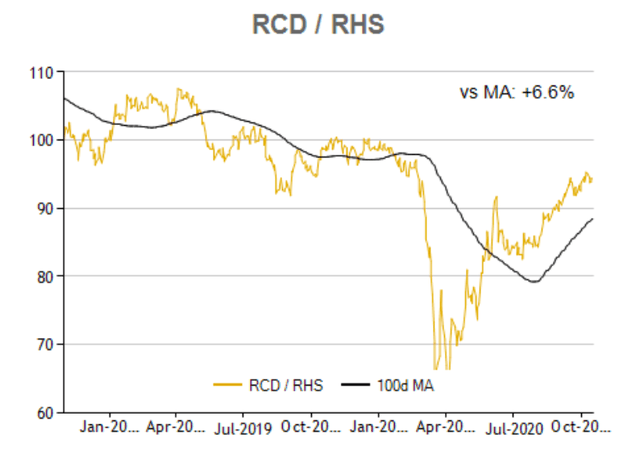
The portfolio is rebalanced monthly and all we have to do is buying either SPY or IEF depending on the position of the consumer discretionary to consumer staples ratio. There is no forecast or prediction whatsoever involved in the process, and this model doesn't require much trading activity at all.
The chart shows historical performance for the quantitative strategy versus a 60/40 benchmark since 2008. The strategy gained 599.7% versus a cumulative gain of 105.4% for the benchmark in the same period.
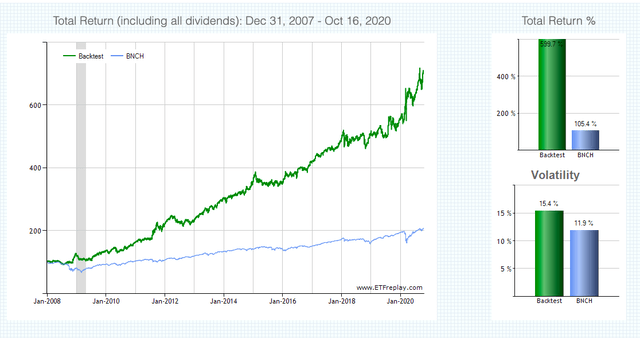
Source: ETFreplay
In annual terms, the strategy produced 16.4% versus 5.8% for the benchmark. More importantly, the maximum drawdown, meaning maximum decline from the peak, is 18.9% for the consumer trend model versus 34.7% for the benchmark.
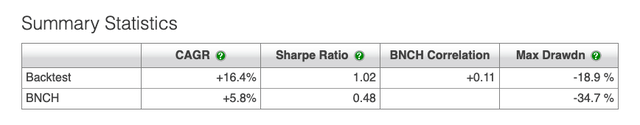
Source: ETFreplay
If we compare the Consumer Trend Model versus a buy and hold position in SPY, the results are also quite strong. Return is 16.4% per year for the model versus 9.2% for buy and hold investors in SPY, and the maximum drawdown is less than half, at 18.9% for the quantitative strategy versus 52.3% for the market tracking ETF.
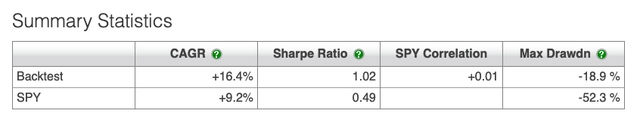
Source: ETFreplay
Looking at the annual returns for the strategy versus the benchmark, we can gain some valuable insights. The strategy outperformed by a wide margin during the bear market in 2008 because it was mostly positioned in Treasuries at the time.
More recently, the model was positioned in bonds at the end of January, and then it turned back to SPY in June. The entry was much slower than ideal, but overall the strategy did a solid job at avoiding the decline due to the COVID-19 selloff and then riding the recovery in SPY once such a recovery was firmly in place.
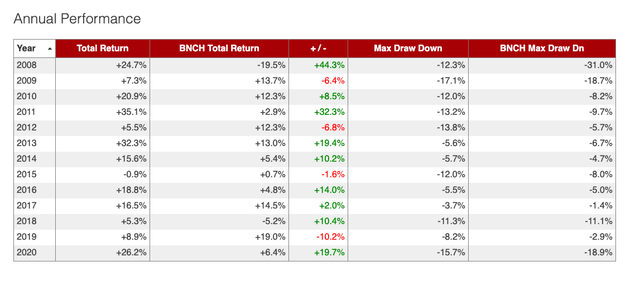
Source: ETFreplay
The strategy only trades once per month, so there is always the possibility that the portfolio will be wrongly positioned and it won't be able to react with enough speed if the market decline happens in a short period of time. The strategy reads trends, but it also needs some time to adapt to changing conditions when the trends are changing in direction.
Another big drawback is that the strategy typically produces lots of false signals in sideways years such as 2015, for example. That said, it generally performs well in terms of capitalizing on big bull markets and avoiding severe bear markets in SPY.
The main point is not making investment decisions based on one single indicator or strategy. We need to have multiple tools and indicators to evaluate market conditions, and then we should always manage our risk exposure by weighting the evidence from these multiple indicators.
In any case, an investment approach supported by hard data is clearly superior to one based on opinions alone. The Consumer Trend Model is currently sending a bullish signal for SPY, and it generally doesn't pay to bet against the U.S. consumer.
Disclosure: I am/we are long AMZN.
Disclaimer: I wrote this article myself, and it expresses my own opinions. I am not receiving compensation for it. I have no business relationship with any ...
more

