
Elliott Wave Technical Analysis: Analog Devices Inc. - Wednesday, Nov. 9

Image Source: Pixabay
Analog Devices Inc., Elliott Wave Technical Analysis
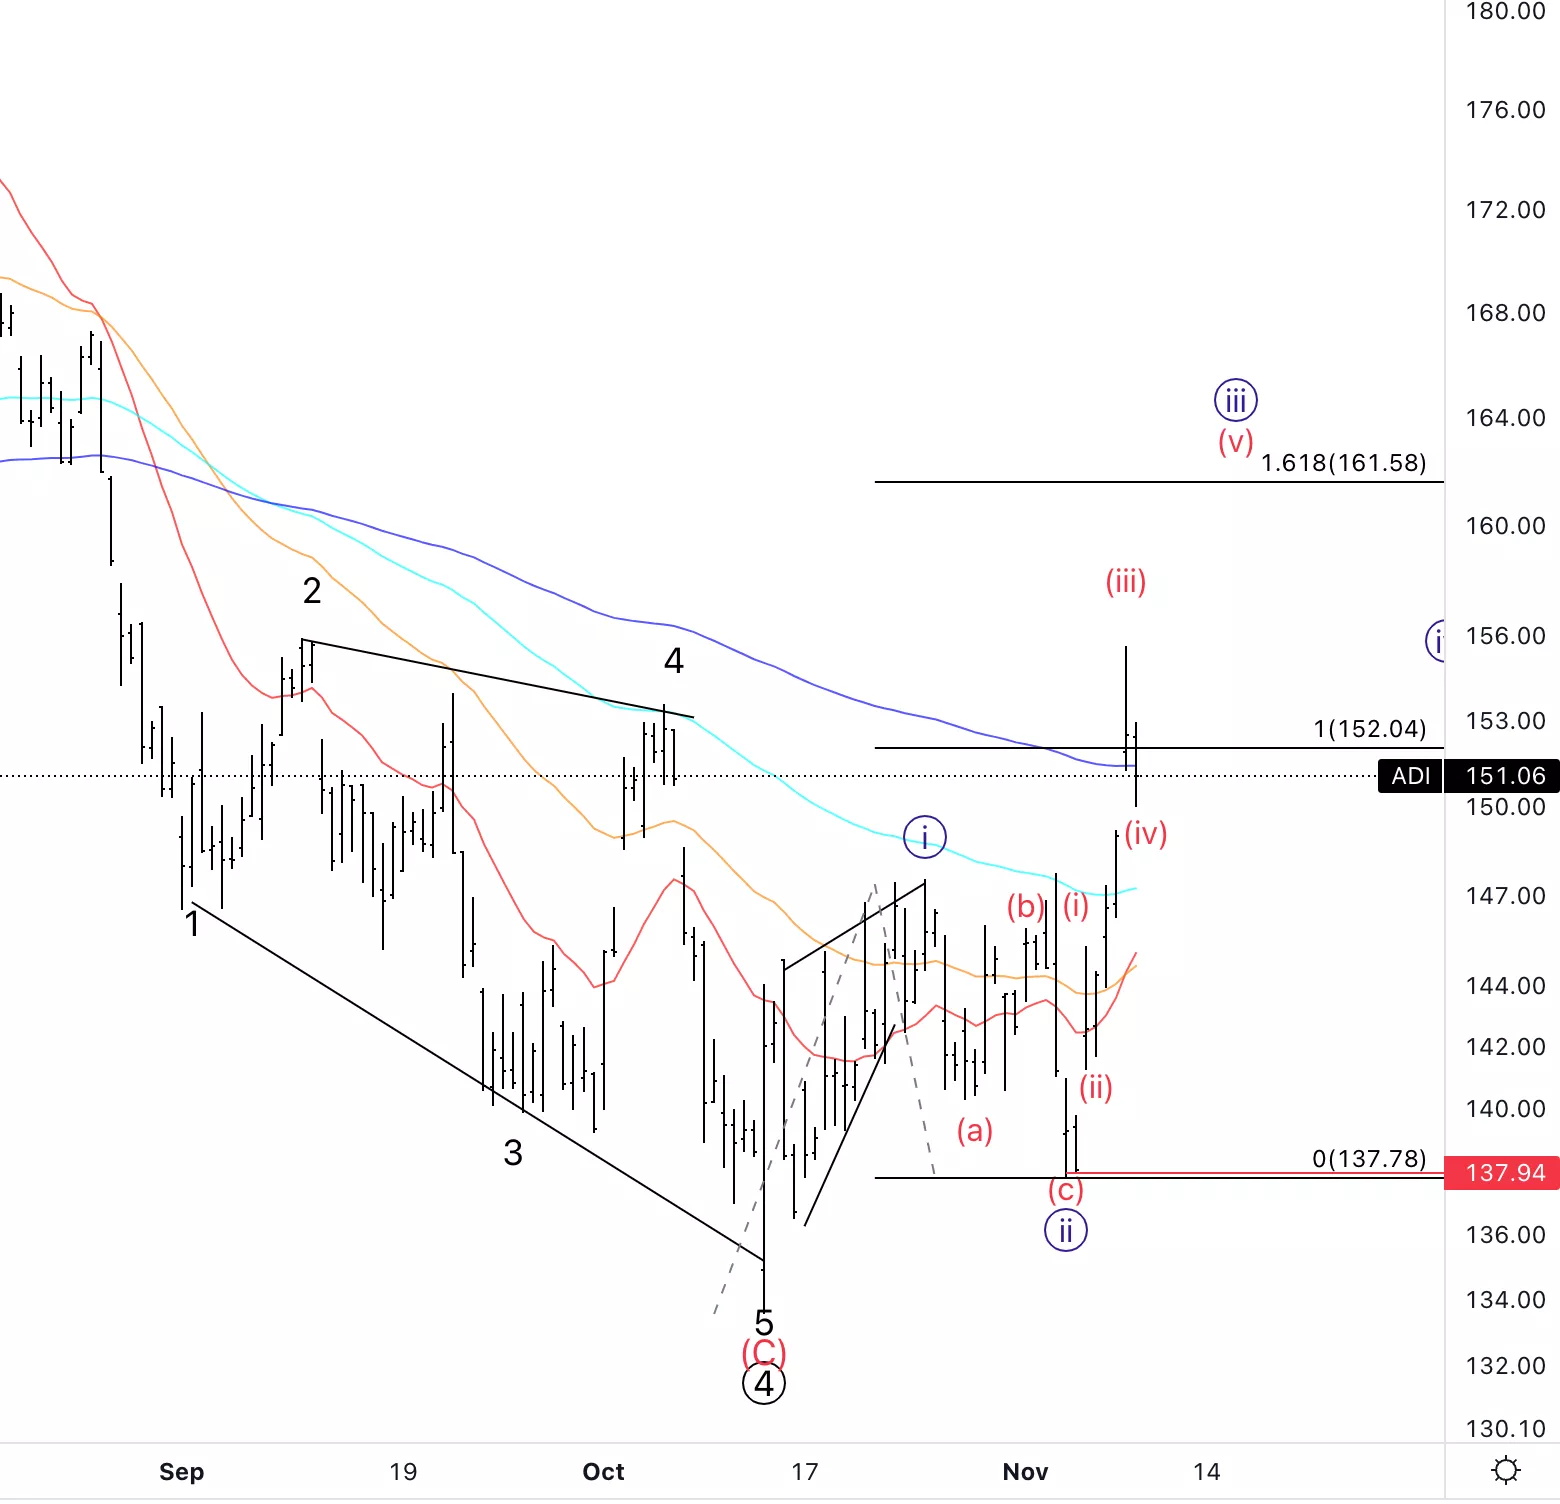
Analog Devices Inc., (Nasdaq: ADI): Daily Chart, November 9, 2022,
ADI Stock Market Analysis: Moving perfectly as expected from the previous forecast. We are looking for an overall resumption of the previous uptrend. Looking to see further upside before considering long-term positions.
ADI Elliott Wave Count: Wave {iii} of 1.
ADI Technical Indicators: 200EMA acting as resistance.
ADI Trading Strategy: Looking for an established and clear five-wave move to the upside into wave 1.
Analyst: Alessio Barretta

Analog Devices Inc., ADI: 4-hour Chart, November 9, 2022
Analog Devices Inc., Elliott Wave Technical Analysis
ADI Stock Market Analysis: Potentially we are within a wave {iii} meaning that we should be able to identify five subwaves. It looks like we are forming wave (iv) of {iii}.
ADI Elliott Wave count: Wave (iv) of {iii}.
ADI Technical Indicators: Using the 200EMA as support.
ADI Trading Strategy: Looking for a short-term long position if we are able to get a clearer view of the nature of potential wave (iv).
More By This Author:
SP500 & Nasdaq Elliott Wave Analysis
Elliott Wave Technical Analysis: The Trader Desk Inc. - Tuesday, Nov. 8
Elliott Wave Technical Analysis: Dogecoin, Tuesday, Nov. 8
Disclosure: As with any trading or investment opportunity there is a risk of making losses especially in day trading or investments that Trading Lounge expresses opinions on. Note: Historical ...
more

