
Edwards Lifesciences: Near-Term Techno-Fundamental Metrics
Edwards Lifesciences (EW) is a prominent player in heart valves technology and cardiovascular critical care. In Q2 2020, the company beat revenue estimates by $133 million and EPS estimates by $0.15 (operating income basis). The stock is currently trading at $76.94 as of August 7, 2020, a price that is near its all-time high of about $82.50. Over 20 analysts have upped its target price while none has ventured to mark it down.
The stock has gained strength in the recent past and is looking formidable – but can it be bought now? Should investors wait for a correction? Here is my analysis that takes into account charts, fundamentals, option chain, and news.
News Analysis
EW has recently settled an intellectual property dispute with Abbot Laboratories (ABT) by booking a pretax charge of $368 million in Q2 2020. The company also will incur royalty expenses of $100 million between now and 2024, which will be accounted for as cost of sales. EW has paid $100 million cash payment to Abbot in July 2020, and the balance will be paid in the future.
The company estimates that its sales will remain flat in 2020 as compared to 2019.
EW’s Valuation
Investors and analysts fancy EW because of its profitable products, robust pipeline, and long-term prospects. There’s no doubt the company will do great in the long run – however, this post analyzes the stock from a near-term perspective and attempts to answer whether EW’s current price is a buy.
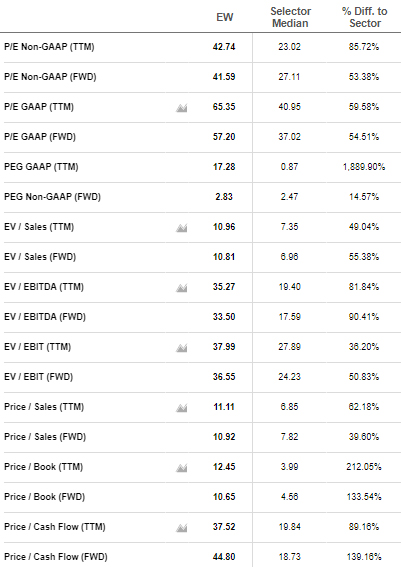
Image Source: Seeking Alpha
EW is currently richly valued because its market price has been driven up by investors eager to invest in a stock with massive potential. A TTM PE of 42.74, TTM PEG of 17.28, TTM P/B of 12.45, and TTM Price-to-Sales of 11.11 suggest the stock is overvalued in the near term – so long you don’t compare it with Tesla.
EW Chart & Option Chain Check
(a) Weekly Chart Signals
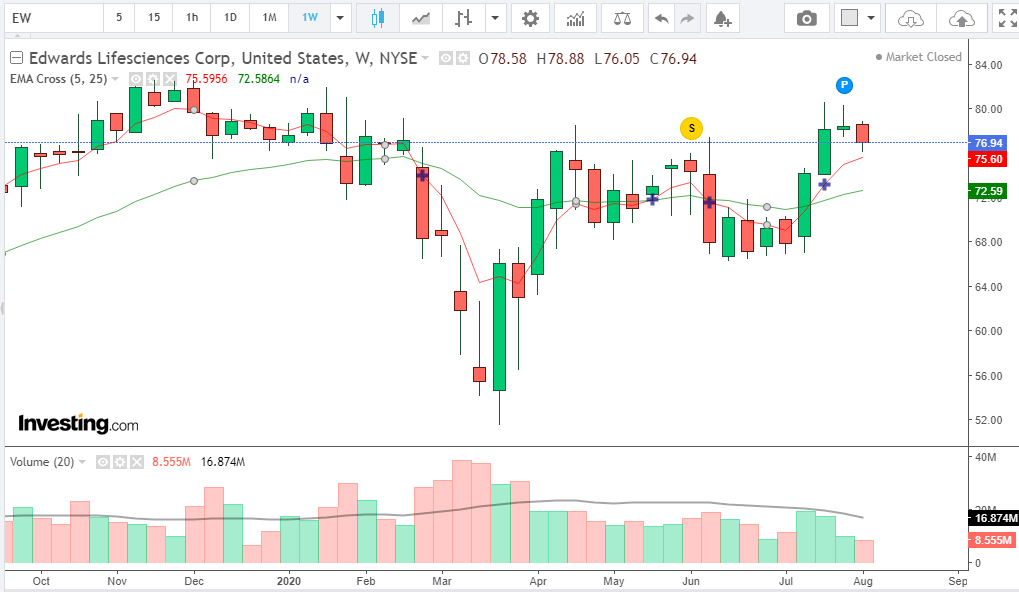
Image Source: Investing.com
This chart shows that both the shorter-term 5-week EMA and the longer-duration 25-week EMA are rising. The 5-week EMA is above the 25-week EMA and the price has closed above both these averages. This suggests that the stock could be in strong hands with its near-term support levels placed at $75.60 and $72.59.
(b) Daily Chart Signals
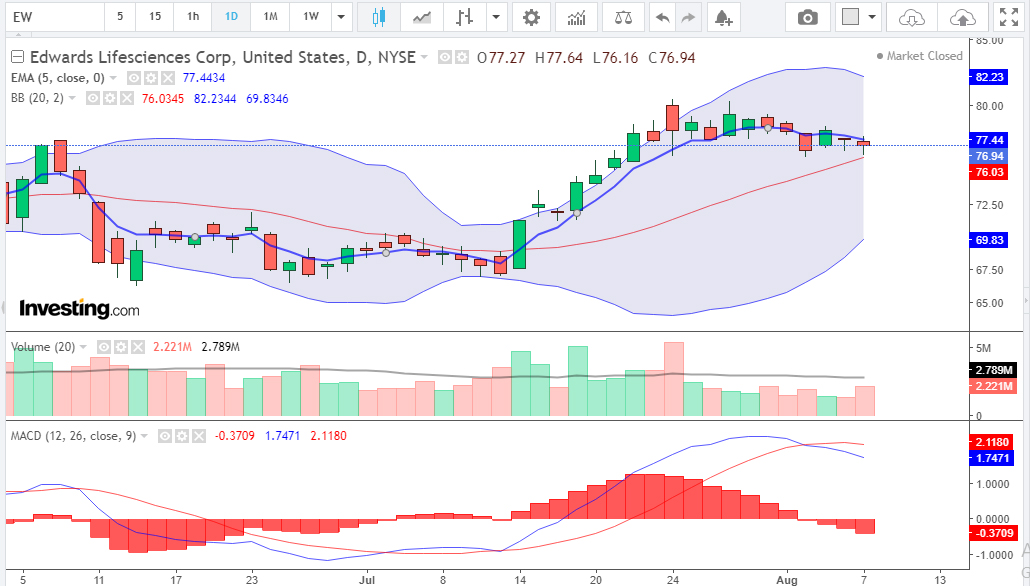
Image Source: Investing.com
This chart shows that EW has closed below the 5-day EMA line, which is drooping. It suggests that the trend has weakened in the near term. The 5-day EMA level of $77.44 has now become the resistance level to track.
The middle Bollinger Band (default value of 20, 2) suggests that a near-term support level exists at $76.03.
The daily MACD (default settings of 26, 12, 9) Line has crossed below the Signal Line and it is a bearish near-term signal. A drooping MACD Line also suggests that the averages are steadily falling.
The MACD Histogram value is in the negative territory and its negative value is decreasing day over day, confirming that the near-term trend is negative.
(c) Option Chain
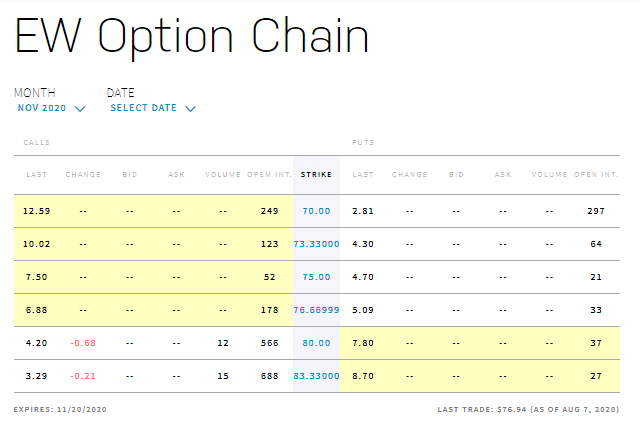
Image Source: NASDAQ
EW’s November 2020 option chain open interest suggests that there is an adequate supply of calls at $80 and $83.33. The premium on these calls fell on August 7, 2020, suggesting that supply exceeds demand. These call writers are most likely investors who are probably hedging their longs.
Summing Up
Though EW’s long-term prospects are exciting, the near term looks weak. The option chain data of November 2020 suggest that the stock can witness selling pressure at higher levels between $80 and $83.
Though the weekly charts suggest the stock is in strong hands, the daily charts suggest that it is looking weak and has support at $75.60 while its resistance is placed at $77.64.
Though the $368 million hit that the company will take after settling with Abbot seems to be discounted along with its flat 2020 guidance, I would watch out for another bit of news that can spell bearishness – the delay or flaws in Stimulus-2 because of political disagreements.
As I write this post, the Dow is up 220 points, but we all know that this is a narrow market and a few stocks will help the indices as the broader market suffers.
If I were a near-term trader, I would wait to see if EW breaks its resistance at $77.64. That would indicate a buy for 1–2% gains. I also would assume that the upside is capped somewhere in the $80–83 range.
Conversely, if EW falls, I would wait for it to break its support levels of $76.03 and $75.60. Below these levels, it looks like a shorting candidate for a 1–2% gain.
If I were a short- to medium-term investor who just cannot wait, I would buy it at its current price and sell November $80–83 calls to hedge my positions.
This is my trading and investing strategy for EW in the near term.
Disclosure: I have no position in the stocks discussed, and neither do I plan to buy/sell it in the next 72 hours. I researched and wrote this article. I am not being compensated for it (other ...
more


So we can see, at least from where I stand, that sales remaining flat is not so very bad if one is doing quite well. Growth is not always a required condition to be doing well. I do realize that this may be an unpopular opinion.
Interesting perspective. I had never really thought about it quite like that.
I understand that mine is not a common point of view. And I also appreciate that it has not been attacked for being so different.
Agree. When current growth is flat but prospects are great, one can always invest in a SIP