
Economy In A Nose Dive
The Bureau of Economic Analysis announced today that U.S. real GDP fell at a 4.8% annual rate in the first quarter of 2020. That’s a rate of decline that we only see historically during the worst quarter of a recession.
(Click on image to enlarge)
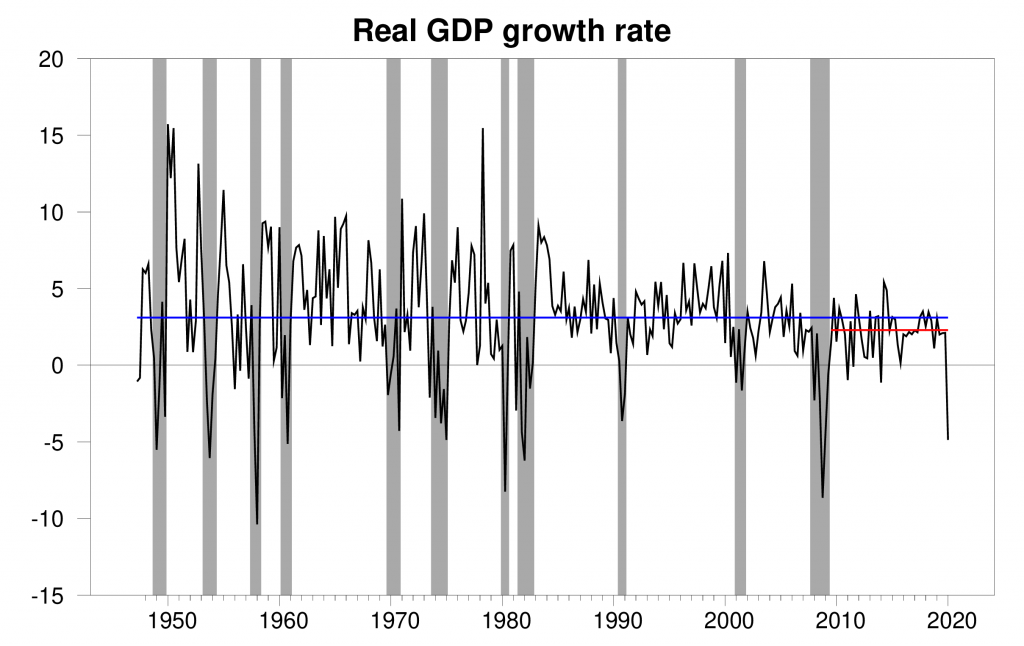
Real GDP growth at an annual rate, 1947:Q2-2020:Q1, with the 1947-2019 historical average (3.1%) in blue and post-Great-Recession average (2.3%) in red.
The new data brought the Econbrowser Recession Indicator Index up to 32.5%, the highest it’s been since the Great Recession. This is not a forecasting tool, but rather is an assessment looking back at where the economy was in the fall quarter of 2019. Its pessimistic assessment of 2019:Q4 is based on the dismal initial GDP report for 2020:Q1 and the fact that expansions and recessions exhibit substantial inertia. We will wait for revisions of the 2020:Q1 GDP estimate and the initial report of 2020:Q2 GDP before calculating the value of the index for 2020:Q1.
(Click on image to enlarge)

GDP-based recession indicator index. The plotted value for each date is based solely on information as it would have been publicly available and reported as of one quarter after the indicated date, with 2019:Q4 the last date shown on the graph. Shaded regions represent the NBER’s dates for recessions, which dates were not used in any way in constructing the index, and which were sometimes not reported until two years after the date.
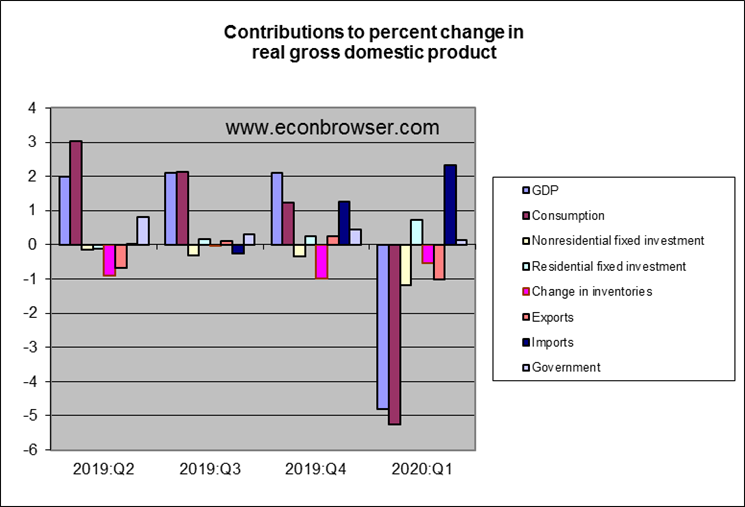
Lower consumption spending led the nosedive. Lower spending on consumer services, normally one of the most stable components of GDP, by itself would have caused a 5.1% annualized decline in the overall real GDP growth rate if all other spending had held steady. Consumer durables, a more typical casualty in recessions, played its normal role, subtracting another 1.2% from the GDP growth rate. Construction of new homes was one bright spot, making a modest positive contribution.
(Click on image to enlarge)
The numbers are all the more dreadful when we realize that 2020:Q1 GDP was the sum of three months, the first two of which were fairly decent. An indicator of what’s in store comes from new claims for unemployment insurance, which have been literally off the charts.
(Click on image to enlarge)
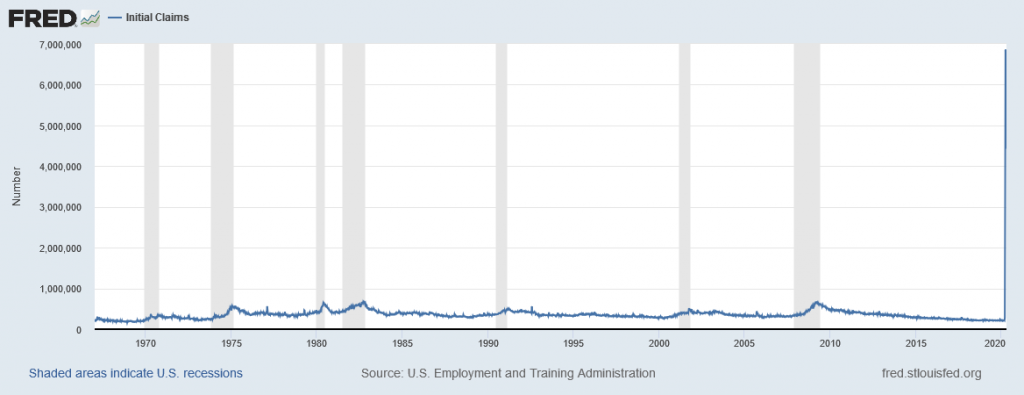
Number of people filing initial claims for unemployment insurance each week, seasonally adjusted, Jan 7, 1967, to Apr 18, 2020. Source: FRED.
In the last six weeks, the total number of new claims for unemployment insurance was 25.4 million more than usually expected over 6 weeks. Millions of more newly unemployed are expected to be added to those 25 million people when last week’s number is announced tomorrow. This compares with a baseline count of 6 million people already unemployed and a total labor force of 163 million.
(Click on image to enlarge)
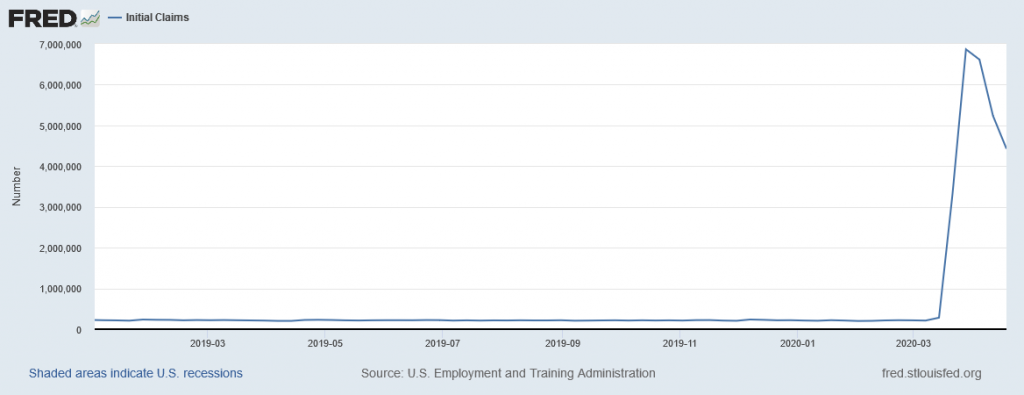
Number of people filing initial claims for unemployment insurance each week, seasonally adjusted, Jan 5, 2019, to Apr 18, 2020. Source: FRED.
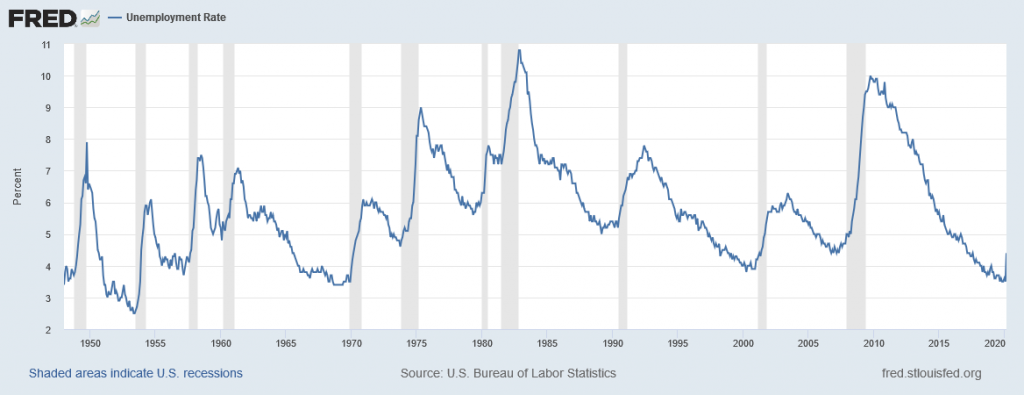
If say 20 million of the new filers are still unemployed by the second week of May (the reference week for the May unemployment report), we’d be talking about an unemployment rate of 26/163 = 16%. As a reality check on that calculation, the Congressional Budget Office is currently anticipating an average unemployment rate of 14% for 2020:Q2. Their numbers or mine would again be off the charts, higher than anything the U.S. has experienced since World War II. For reference, the most recent unemployment rate reported for the U.S. (focused on the second week of March) was 4.4%.
(Click on image to enlarge)
We can do a quick calculation of what this could mean for GDP. Okun’s Law is a relation between GDP growth and the unemployment rate. In its simplest form, we can calculate a regression of quarter t‘s real GDP growth on the change in the unemployment rate between the last months of quarters t -1 and t. The results of this regression, estimated for t running from 1948:Q2 to 2020:Q1, are as follows ((standard errors in parentheses):
(Click on image to enlarge)

Note that I’ve measured the left-hand variable GDP growth here as 100 times the quarterly change in the natural logarithm, so these are quarterly, not annualized, GDP growth rates. The equation says that if the unemployment rate increases by 1% in a quarter, we’d expect to see real GDP lower by 1.55% during that quarter. If we’re talking about an 11% higher unemployment rate in 2020:Q2 compared to 2020:Q1, the above regression would predict quarterly real GDP growth for 2020:Q2 of 0.769 – (1.554)(11) = -16.325; approximately a 16% drop in real GDP within the quarter. Quoting that at an annual percentage rate as Americans are accustomed would be [exp(4 x -0.16325) – 1] = -48.0%. That is, instead of the -4.8% number that BEA reported for 2020:Q1 GDP growth, we could see -48% for Q2.
CBO is projecting a number for that headline annualized 2020:Q2 real GDP growth rate of -40%. Morgan Stanley says -38%.
Bottom line: the 2020:Q1 GDP numbers are very bad. The Q2 numbers could be an order of magnitude worse.
Disclosure: None.


