
Joe Sixpack’s Situation: 3Q2013 View Continues To Improve But At Slower Rate

A Federal Reserve data release (Z.1 Flow of Funds) for 3Q2013 provides insight into the finances of the average household – and our beloved “Joe Sixpack”. Our modeled “Joe Sixpack” – who owns a house and has a job, and essentially no other asset. We have also modeled a Joe who has financial assets whom is called “Middle Man”.
You may ask why this analysis is important? It looks at the financial health of the average consumer – and in a consumption based economy, it measures the dynamics effecting the consumer.
What is concerning is that the 35% of Americans who have no home or assets are no better off – and have no path to consume more.
First, from the Z.1 Flow of Funds report, what was shown about Household Net Worth and Growth of Domestic Nonfinancial Debt. Net worth continues to grow:

The Joe Sixpack Index
The Joe Sixpack Index is a composite index of home prices and wage income. Since 2010, this index has been trending up (even though income has been relatively flat) due to home price decline moderating and then clearly improving – and has shown positive growth for 6 of the last 7 quarters.
- The data in this index is only updated every three months, and the data was updated with the release of the Federal Reserves Z.1 Flow of Funds.
- It is inflation and population adjusted.
- The First Time Home Buyer’s Stimulus (caused by Bush era legislation) spike in 2009 distorted the index
Joe Sixpack Index (blue line, left axis) shown against GDP (red line, right axis)
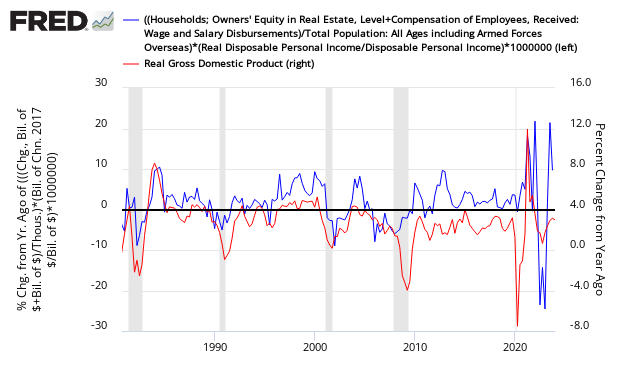
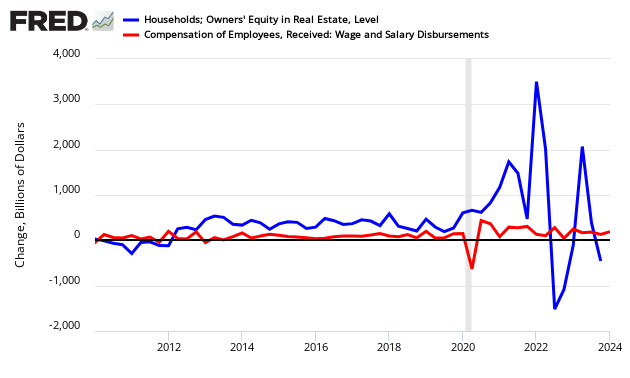
The growth rate of the index again declined in 3Q2013 – but still seems to be in a multi-year uptrend channel (albeit at the lower boundary of this channel in 3Q2013). But viewing the graph below, there is little good news with Joe’s compensation.
Change in Owner’s Equity (blue line) and Change in Compensation (red line)
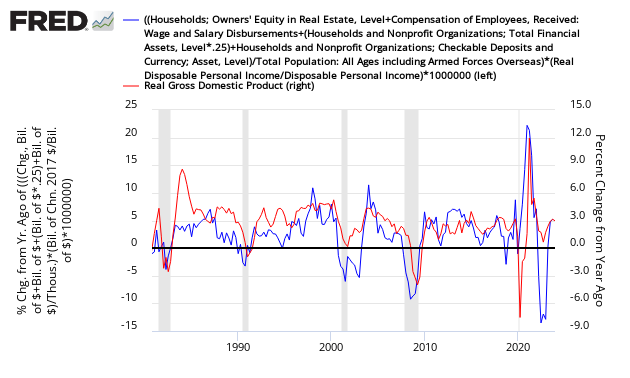
The Middle Man Index
The middle class household with financial assets and real estate assets is Middle Man. A Federal Reserve Publication shows the percentage of households owning various financial assets. Other than real estate, Middle Man holds transaction accounts (checking – 1% of all financial assets) and retirement accounts (roughly estimated by Econintersect at 25% of household financial assets).

Unfortunately, retirement accounts are not separately detailed in the Z.1 reporting – but in the graph below uses 25% of the change in Total Household Assets as a proxy for retirement accounts.
Total Household Assets (blue bars) vs Savings (red bars)

Adding the financial assets of Middle Man to the housing and compensation data used in the Joe Sixpack index – we see that Middle Man would be much happier with his situation in 1Q2013 than Joe Sixpack. It is the growth in value of real estate and other assets that is the governing factor for both Joe and Middle Man. Incomes statistically are not growing.
Middle Man Index (blue line, left axis)
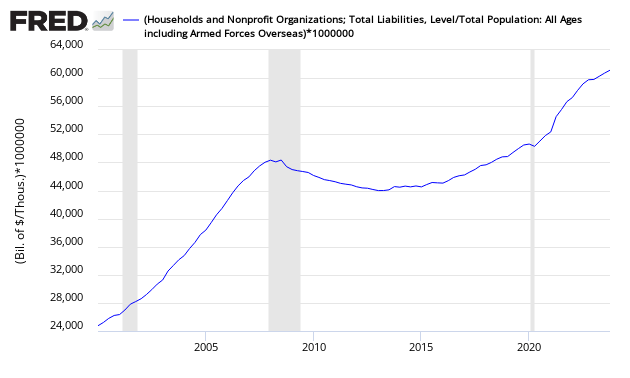
Liabilities
This post would not be complete without a look at the liabilities of households. Here is a current dollar view of the liabilities per capita. 1Q2013 reversed the growth of liabilities seen in 4Q2012 – and consider a major portion of inflows into consumer credit come from student loans which should register increases disproportionately in the first and third quarters.
Liabilities per Capita
Takeaway
My takeaway is:
- The data in this post is not recessionary, however this is a lagging view of the average American’s situation. Having said this, Joe and Middle Man’s consumption is somewhat effected by how rich they feel. It takes some time for the wealth effect to sink in.
- It appears assets (both home ownership and investments) are currently the prime vehicle in 3Q2013 for situational improvement of Middle Man or Joe Sixpack – but a Joe Sixpack who owns no home or investments is only marginally improved.
- Consumers are now taking on more debt.
- Middle Man seems to be doing much better than Joe Sixpack.
Caveats on this Post:
Most of the data in this post comes from “Flow of Funds Accounts of the United States” (Z.1) data release from the Federal Reserve which is released quarterly. AlthoughEconintersect can validate the data in general using other sources, micro movements are difficult to validate. Importantly, the Z.1 data is a treasure chest of aggregated data across all sectors of the economy – and an invaluable tool in evaluating historical relationships.
The Joe’s Index was introduced by Econintersect in a 07 July 2012 post. This index is documented at the bottom of the July 2012 economic forecast.
To begin, one needs to define Joe Sixpack. Urban dictionary defines Joe:
Average American moron, IQ 60, drinking beer, watching baseball and CNN, and believes everything his President says.
Too many of us think we are smarter than Joe – and are above Joe in the social order. Most of us are Joe. Per Wikipedia:
John Q. Public (and several similar names; see the Variations section below) is a generic name in the United States to denote a hypothetical member of society deemed a “common man.” He is presumed to represent the randomly selected “man on the street.” Similar terms include John Q. Citizen and John Q. Taxpayer, or Jane Q. Public, Jane Q. Citizen, and Jane Q. Taxpayer for a woman. The name John Doe is used in a similar manner. For multiple people, Tom, Dick and Harry is often used. Roughly equivalent are the names Joe Six-pack, Joe Blow, the nowadays less popular Joe Doakes and Joe Shmoe ….
Almost all Americans who MUST work to survive are Joes. Americans who are relying on some level of earned income during retirement are Joes. I believe anyone who sees themselves as middle class (educated or not – professional or blue collar) is a Joe. Joe is somewhere around average American:
- Joe’s median family unit spends or makes about $50K per year
- Joe’s median net worth was $120K in 2007
By definition over 50% of Americans are Joes.
The Z.1 data is based on averages not medians. In other words, the rich are getting richer – and this influences the averages.
None.


