
ECRI Recession Watch: Weekly Update Advisor Perspectives
The Weekly Leading Index (WLI) of the Economic Cycle Research Institute (ECRI) is at 133.0, up from last week's 133.0. The WLI annualized growth indicator (WLIg) to one decimal place came in at 2.5, up from last week's 1.9.
Last year ECRI switched focus to their version of theBig Four Economic Indicators that I routinely track. But when those failed last summer to "roll over" collectively (as ECRI claimed was happening), the company published a new set of indicators to support their recession call in a commentary entitled The U.S. Business Cycle in the Context of the Yo-Yo Years(PDF format). Subsequently the company took a new approach to its recession call in a publicly available commentary on the ECRI website: What Wealth Effect?. That commentary includes a brief discussion of the Personal Consumption Expenditure (PCE) deflator, which I've discussed in more detail here. It also includes an illustration of the shrinkage in US imports since the post-recession peak nearly three years ago.
In early November, after about three months of hibernation, ECRI co-founder spokesman Lakshman Achuthan appeared on Bloomberg TV, reaffirming his company's recession call.
The most recent publicly available article on ECRI's website remains the December 11th Becoming Japan: Update, which features this overlay:
Here is ECRI's key message:
| What many still fail to acknowledge is that the major Western economies – including the U.S.– are effectively becoming Japan: the comfortable consensus is that, in contrast to the Eurozone, inflation in the U.S. should be (to quote the Fed) "moving back toward its longer-run objective" of 2%, and thus not a concern. But should it be a concern, with yoy growth in the Personal Consumption Expenditures deflator falling to a four-year low of 0.7%, increasingly distant from the Fed's 2% target, precisely as ECRI had predicted? |
Although I disagree with ECRI's recession call, the company is correct in its assessment of the Fed's inability to lift inflation to its target. For more on that topic, see my twice monthly update: Two Measures of Inflation: CPI and the PCE Price Index and Fed Policy.
The ECRI Indicator Year-over-Year
Here is a chart of ECRI's data that illustrates why the company's published proprietary indicator has little credibility as a recession indicator. It's the smoothed year-over-year percent change since 2000 of their weekly leading index. I've highlighted the 2011 date of ECRI's recession call and the hypothetical July 2012 business cycle peak, which the company claims was the start of a recession.

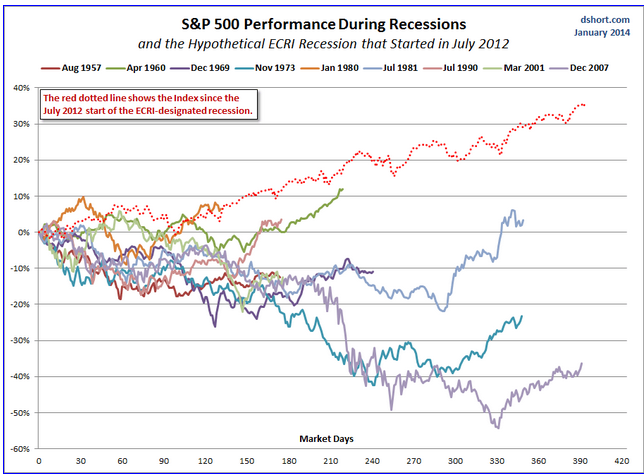
As for the disconnect between the stock market and the recession that ECRI claims began in July 2012, Achuthan has repeated pointed out the market can rise during recessions. See for example the 2:05 minute point in the November 4th video. The next chart gives us a visualization of the S&P 500 during the nine recessions since the S&P 500 was initiated in 1957. I've included a dotted line to show how the index has performed since ERIC's July 2012 recession start date. The trough in ECRI's recession came nine market days after the start -- down 2.0%.
Here are some notable developments since ECRI's public recession call on September 30, 2011, now well beyond its second anniversary:
- The S&P 500 is up 57.5%.
- The unemployment rate has dropped from 9.0% to 6.7%.
- GDP has risen to 4.1% in the latest update.
My opinion remains unchanged: The ECRI's credibility depends on major downward revisions to the key economic indicators. The July 2013 annual revisions to GDP weren't adequate to substantiate ECRI's position. On the other hand, I would point out that a standard data manipulation of Real GDP, the rear-view mirror on the economy that popular thought associates with recession calls, underscores current economic weakness -- or to put it more euphemistically, "slow growth". I'm referring to the year-over-year GDP percent change (the chart below). The latest GDP update (through the Q3 Third Estimate) shows the current data point is lower than at the onset of nine of the eleven recessions since the inception of quarterly GDP.

We get a similarly weak picture in the YoY Real Final Sales (which excludes changes in private inventories). Here are two snapshots of this quarterly indicator: The complete series since 1948 and a per-capita version since 1960 (the start date of the Census Bureau's mid-month population estimates):


Given the weak growth of real disposable personal incomes per capita, the lethargy of Real Final Sales comes as no surprise.
For alternatives to ECRI's recession forecasting, see method developed by Anton and Georg Vrba:
See also Dwaine Van Vuuren's latest RecessionALERT indicator snapshot:
Appendix: A Closer Look at the ECRI Index
Despite the increasing irrelevance of the ECRI's recession indicators in recent years, let's check them out. The first chart below shows the history of the Weekly Leading Index and highlights its current level.

For a better understanding of the relationship of the WLI level to recessions, the next chart shows the data series in terms of the percent off the previous peak. In other words, a new weekly high registers at 100%, with subsequent declines plotted accordingly.

As the chart above illustrates, only once has a recession occurred without the index level achieving a new high -- the two recessions, commonly referred to as a "double-dip," in the early 1980s. Our current level is 11.9% off the most recent high, which was set over five years ago in June 2007. We're now tied with the previously longest stretch between highs, which was from February 1973 to April 1978. But the index level rose steadily from the trough at the end of the 1973-1975 recession to reach its new high in 1978. The pattern in ECRI's indictor is quite different, and this has no doubt been a key factor in their business cycle analysis.
The WLIg Metric
The best known of ECRI's indexes is their growth calculation on the WLI. For a close look at this index in recent months, here's a snapshot of the data since 2000.

Now let's step back and examine the complete series available to the public, which dates from 1967. ECRI's WLIg metric has had a respectable record for forecasting recessions and rebounds therefrom. The next chart shows the correlation between the WLI, GDP and recessions.

The History of ECRI's Latest Recession Call
ECRI's weekly leading index has become a major focus and source of controversy ever since September 30, 2011, when ECRI publicly announced that the U.S. is tipping into a recession, a call the Institute had announced to its private clients on September 21st. Here is an excerpt from the announcement:
| Early last week, ECRI notified clients that the U.S. economy is indeed tipping into a new recession. And there's nothing that policy makers can do to head it off. ECRI's recession call isn't based on just one or two leading indexes, but on dozens of specialized leading indexes, including the U.S. Long Leading Index, which was the first to turn down — before the Arab Spring and Japanese earthquake — to be followed by downturns in the Weekly Leading Index and other shorter-leading indexes. In fact, the most reliable forward-looking indicators are now collectively behaving as they did on the cusp of full-blown recessions, not "soft landings." (Read the report here.) |
Year-over-Year Growth in the WLI
Triggered by another ECRI commentary, Why Our Recession Call Stands, I now include a snapshot of the year-over-year growth of the WLI rather than ECRI's previously favored method of calculating the WLIg series from the underlying WLI (see the endnote below). Specifically the chart immediately below is the year-over-year change in the 4-week moving average of the WLI. The red dots highlight the YoY value for the month when recessions began.

The WLI YoY is now at 4.0%, which is higher than the onset of six of the seven recessions in the chart timeframe, although well off its 7.5% interim high set in mid-June. The second half of the early 1980s double dip, which was to some extent an engineered recession to break the back of inflation, is a conspicuous outlier in this series, and it started at a WLI YoY of 4.1%.
Additional Sources for Recession Forecasts
Dwaine van Vuuren, CEO of RecessionAlert.com, and his collaborators, including Georg Vrba and Franz Lischka, have developed a powerful recession forecasting methodology that shows promise of making forecasts with fewer false positives, which I take to include excessively long lead times, such as ECRI's September 2011 recession call.
Here is today's update of Georg Vrba's analysis, which is explained in more detail in this article.

Earlier Video Chronology of ECRI's Recession Call
- September 30, 2011: Recession Is "Inescapable" (link)
- September 30, 2011: Tipping into a New Recession (link)
- February 24, 2012: GDP Data Signals U.S. Recession (link)
- May 9, 2012: Renewed U.S. Recession Call (link)
- July 10, 2012: "We're in Recession Already" (link)
- September 13, 2012: "U.S. Economy Is in a Recession" (link)
Note: How to Calculate the Growth series from the Weekly Leading Index
ECRI's weekly Excel spreadsheet includes the WLI and the Growth series, but the latter is a series of values without the underlying calculations. After a collaborative effort by Franz Lischka, Georg Vrba, Dwaine van Vuuren and Kishor Bhatia to model the calculation, Georg discovered the actual formula in a 1999 article published by Anirvan Banerji, the Chief Research Officer at ECRI: "The three Ps: simple tools for monitoring economic cycles - pronounced, pervasive and persistent economic indicators."
Here is the formula:
"MA1" = 4 week moving average of the WLI
"MA2" = moving average of MA1 over the preceding 52 weeks
"n"= 52/26.5
"m"= 100
WLIg = [m*(MA1/MA2)^n] – m
© Copyright 2013, Advisor Perspectives, Inc. All rights reserved.


