
Where Is That Confounded Recession?
“Ah, excuse me. Oh, will ya excuse me. I’m just trying to find the recession. Has anybody seen the recession?”
Ask that question in a roomful of forecasters, and you’ll hear plenty of reasons why the next recession is dead ahead: the inverted yield curve, the tariff war, weak PMIs, the global manufacturing downturn.
Events might eventually prove those recession forecasts to be correct, although I would say not until mid-2020 at the earliest, and a recession at that time remains just a possibility. I say that because we haven’t yet seen enough cause for alarm in the three areas that most reliably predict recessions. Before every recession, we see at least one, usually two and often every one of the following three precursors:
- Deterioration in the housing sector
- Restrictive public policies
- Significant damage to the real spending capacity of households, businesses or both
In other words, when trouble emerges across some combination of housing activity, public policies and real spending capacity, we’ll know to expect a recession. Trouble in one of those areas should put us on alert, whereas two or three would mean we should bank on it. So what’s missing from today’s popular recession narratives is adequate support from the “Big-3” precursors, and without that support, it’s probably too soon to bet on a recession. The U.S. economy always expands when the housing sector is stable, public policies are growth-supportive and real spending capacity is increasing. Simply put, no sign of the Big-3 means no recession.
But isn’t there a first time for everything? Can it really be so simple?
There is, and I don’t expect to convince anyone the economy is that simple without first providing some evidence, so I’ll continue. I’ll focus mostly on spending capacity, which is where I stray furthest from traditional, mainstream methods.
Why spending capacity?
Behavioral research, empirical data and casual observation all point towards households and businesses increasing their spending for as long as they have the capacity to do so. Changes in spending capacity predict changes in spending with remarkable accuracy, notwithstanding the Keynesian idea that spending follows the mysterious ebbs and flows of “animal spirits.” In fact, the spirits described by Keynesians might not be all that mysterious—they’re always present in some degree, they just happen to flow in proportion to spending capacity. They don’t disappear for no particular reason and then later reappear.
So I suggest closing your Keynesian textbook and looking instead to natural human behavior for clues about spending. Behavioral research tells us we’re naturally overconfident, believing our ventures will succeed with a certainty that defies the true probability of success. It also tells us we’re at least partially blind to certain obstacles to success, such as basic randomness. We’re naturally wired to have an illusion of control and an optimism bias alongside hindsight and confirmation biases, all of which encourage us to spend for as long as we have the capacity to do so.
But that’s not all. We’re also prone to a lack of self control that researchers have termed present bias and a tendency to spend like drunken sailors whenever in the company of other free-spending drunken sailors, thanks to our natural herding bias. I could go on, but you get the idea—once we consider human nature, it’s easier to appreciate why spending capacity is the economy’s driving force.
What Exactly Is Spending Capacity?
All that being said, I still need to define spending capacity, and my definition is broader than you might think. It starts with earnings—both household and business earnings—which of course help determine the resources available to be spent. It also includes risky asset prices, because spending depends partly on house price cycles and investment portfolio values. In fact, spending is more exposed to asset price volatility than ever before, with assets owned by households and nonprofits currently valued at 608% of annual GDP, compared to averages of 385% in the 1970s, 407% in the 1980s, 454% in the 1990s and 537% in the first decade of the 2000s.
Finally, there’s a third piece that’s usually overlooked, and I blame the economics profession for that. Spending depends not only on what households and businesses earn and own, as noted, but also on what they can borrow. And it depends not just on what they can borrow, but on what they can borrow from banks, in particular.
Why banks as opposed to other types of lenders?
Because banks are the only lenders that create spending power from “thin-air.” That’s not something you’ll learn in mainstream economics, which mangles the mechanics of money and banking, but if you’re trying to understand business cycles, it’s an essential fact. The key insight is that new bank credit expands the circular flow of income and spending (see the chart below), whereas other types of credit mostly sustain the existing flow by passing spending power from one party to another.
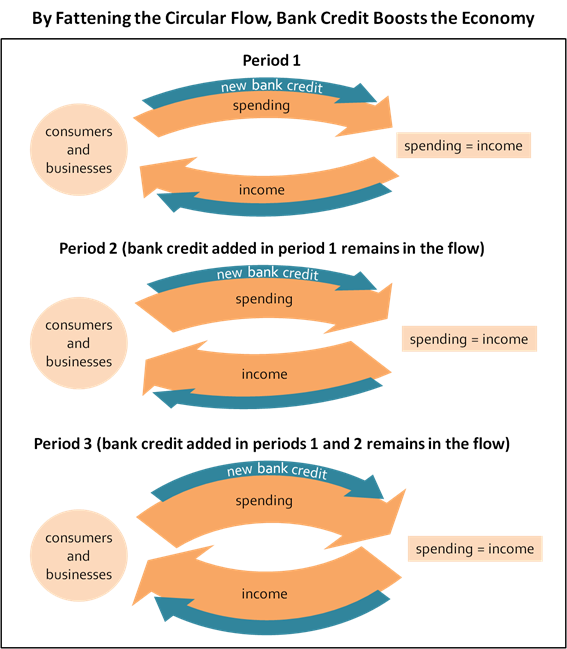
In other words, only banks increase spending power on a net basis, because they can make loans without requiring prior savings from past income. Apart from a small allocation of bank capital, banks conjure loan proceeds from thin air—that’s the crux of what their charters allow them to do. The monetary expansion authorized by bank charters explains why new bank credit is 69% correlated with spending in the same period and 58% correlated with spending in the next period, whereas corresponding figures for credit financed by prior domestic savings (not banks) are negligible (see the chart below).

(As obvious as the charts above might be to those who’ve either worked as bankers or studied banking from up close, mainstream economists tell a different story, teaching that banks are mere intermediaries and only central banks determine the money supply. Those mainstream claims have been called out repeatedly by practitioners, heterodox economists and even central bankers—the Fed, Bank of England and Bank for International Settlements have all provided information refuting textbook money and banking theory—but to no avail. Schools continue to teach money and banking incorrectly at both undergraduate and graduate levels.)
What Do the Big-3 Say about the Next Recession?
So spending capacity depends on real earnings, asset prices and the availability of new bank credit. Getting back to the Big-3 precursors that always materialize in some combination (again, not necessarily all three at once) before recessions, we can expand the third precursor using the determinants of spending capacity. Here’s the expanded list:
- Deterioration in the housing sector
- Restrictive public policies
- Significant damage to the real spending capacity of households, businesses or both, which could mean any of the following:
- Earnings that fail to keep pace with inflation
- Falling real asset prices
- Restrictive bank credit
We can then expand the list further with more subcategories and by adding the foreign sector, which I include as a less influential input but one that could contribute to a recessionary process. The expanded list includes separate readings for:
- fiscal and monetary policies
- household and business earnings
- house and stock prices, and
- bank credit conditions for households and businesses
Below are my assessments for each item, with comments on at least one of the indicators that support each assessment. (My email subscribers know that this is the same list that drops out of the 6-cycle forecasting approach described in my book, I’ve just tweaked the terminology to match the language used here.)
Housing sector: Not recessionary. Indicators such as new home sales and the NAHB housing market index show housing activity recovering nicely from a period of weakness in 2018.
Fiscal policy: Not recessionary. Government spending is growing at a decent clip in 2019, while taxes and net transfer receipts dropped to a new six-year low as a percentage of GDP in the first half of the year, which can only help household and business spending capacity. Also, July’s debt ceiling deal freed up more federal spending in the 2020 fiscal year.
Monetary policy: Not recessionary. I often use the yield curve slope as a guide to monetary policy, and today’s inverted curve might suggest that monetary policy is recessionary, but I’ve overridden that for three reasons: 1) the Fed barely lifted the inflation-adjusted fed funds rate in the 2015–18 tightening cycle, and therefore, fell far short of the typical recessionary tightening, 2) we’re now 11 months removed from the last rate hike, and 3) we’re three rate hikes into an easing cycle.
Business earnings: Slightly recessionary. With the Q3 earnings season over 70% complete, S&P projects GAAP earnings for the S&P 500 to be 2% lower than the matching year-ago figure, compared to increases of 3% in Q2 and 6% in Q1. S&P 500 operating earnings by I/B/E/S from Refinitiv tell approximately the same story—lower by 0.7% in Q3 (as of Nov. 6) after increasing by 1% in Q2 and 3% in Q1. Factset, by comparison, shows three consecutive year-over-year declines, but the changes are small (-0.3% in Q1, -0.4% in Q2 and likely to be somewhere between -1% and -3% in Q3). So however you look at it, the Q3 earnings dip is shallow. It’s significantly less severe than the 2015–16 earnings recession, although not as easily explained away as being a reflection of oil price volatility—this time the global manufacturing downturn is also part of the story. Factset expects the dip to continue in Q4, whereas projections from S&P and Refinitiv show positive year-over-year growth. All things considered, I have to call business earnings slightly recessionary, but the numbers aren’t yet convincing. Stay tuned.
Household earnings: Not recessionary. Using average hourly earnings as a guide, household earnings growth outpaced inflation by 1.2% over the past 12 months, while real disposable income increased by 3.2% over the same period. By either measure, household earnings are growing strongly enough to support continued gains in consumer spending.
Business credit conditions: Not recessionary. Although demand for C&I loans has stalled of late, ample credit remains available. The Fed’s Senior Loan Officer Opinion Survey (SLOOS) shows that business lending standards haven’t significantly changed in either direction.
Household credit conditions: Not recessionary. Again, lending standards haven’t significantly changed in either direction. Also, bank balance sheets are expanding at a healthy pace—recent data shows banks adding enough real estate loans and mortgage bonds to grow thin-air spending power despite the dip in C&I loan demand.
Stock prices: Not recessionary. Record stock prices have boosted investment portfolio values and should help to support spending.
House prices: Not recessionary but on watch for a possible downgrade. House price growth is decelerating but remains slightly above the CPI inflation rate according to the S&P Case-Shiller 20-city index. It would have to drop another 2% or 3%, depending on changes in consumer inflation, before I would call it a recessionary reading.
Foreign sector: Not recessionary. Although slowing exports have weighed slightly on GDP, imports have dropped as a percentage of GDP (a measure of import penetration) in the first three quarters of 2019. On balance, data fail to support a “recessionary” assessment, although that could change in 2020 with either a steeper drop in exports or a rising propensity to import.
As reminder to regular readers and a heads-up to new readers, I’ve documented the predictive value of indicators discussed above in my 6-cycle forecast articles, my TSP (thin-air spending power) articles and my book Economics for Independent Thinkers.
Conclusions
All Big-3 precursors considered, the near-term outlook is weaker than normal but not yet recessionary—the expansion appears to have enough policy support, spending capacity growth and overall momentum to continue through at least the first quarter or two of 2020.
Deeper into the year, the outlook could darken as many forecasters predict, especially if corporate earnings continue to slide. But we could just as easily see more of the same—an economy that grinds slowly higher as real incomes grow, asset prices trend upwards and bank balance sheets expand. To gauge which of the scenarios is becoming more likely, I suggest watching the Big-3 and tuning out most everything else.
“Have you seen the recession? I ain’t (yet) seen the recession!”*
*In the actual lyrics I’ve based this on, Robert Plant was looking for a bridge, not a recession, although in a song that never had a bridge. So am I saying we’ll never have a recession? Nope, not saying that.
(To receive more frequent updates to the indicators we track, including TSP and our 6-cycle forecasts, send an email with “indicator updates” in the subject line ...
more


All you really need is bad collateral to be recessionary. But this article is a good study in banks expanding the money supply. It is not strictly fiat money, since fiat money has no collateral offset. Bank money is offset by the house as collateral.
Good point.