
What The Fed Did Do At Its Last Meeting On April 30 - May 1, 2019
This article provides an impact assessment of the FOMC April/May 30-1 2019 meeting.
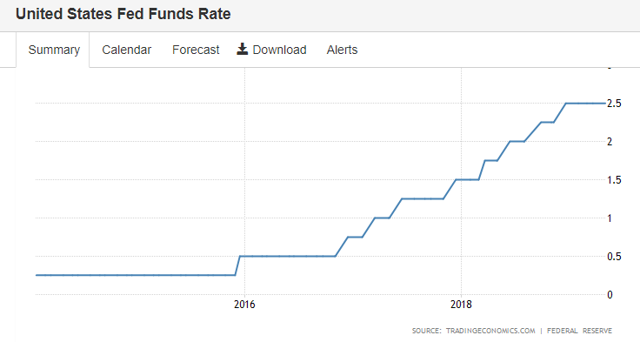
At the meeting, the Fed left the headline rate, the Federal Funds Rate (FFR) alone with no changes as was largely expected and anticipated by market participants.
The chart below shows the current FFR situation.
(Click on image to enlarge)
What Happens When The Fed Changes Rates?
A movement of the FFR has four broad impacts:
- Bank lending costs on required reserves.
- The interest burden on private debt.
- Interest on newly issued Treasury deposits.
- Interest paid on excess reserves, also known as the support rate.
Because the debt and credit levels have changed marginally since my last report, all charts and tables have been brought up to date.
All four impacts are examined in detail below.
Bank Lending Costs
The chart below shows the stock of private debt as a percentage of GDP.
(Click on image to enlarge)
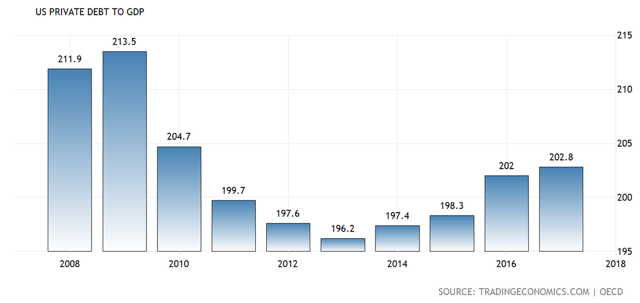
One sees the most current level of private debt-to-GDP is 202.8% for 2017.
The table below shows the impact of the rate hike on bank reserves advanced by the Fed, via the discount window, when a bank makes a loan.
(Click on image to enlarge)
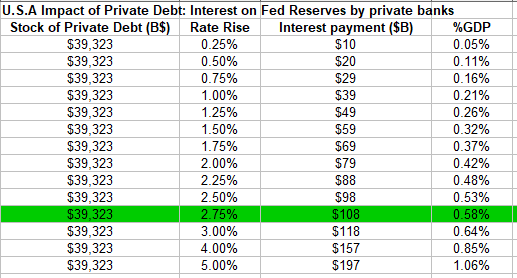
(Source: Author calculations based on Trading Economics GDP measure)
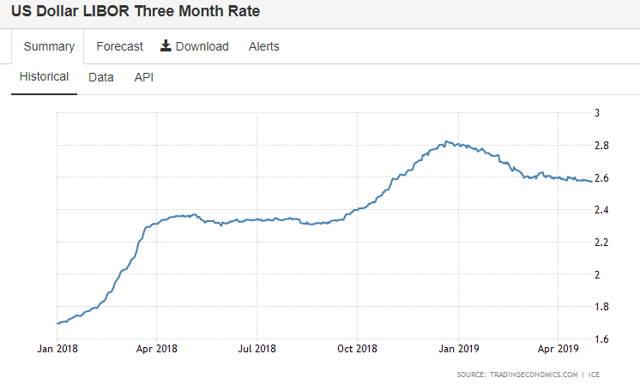
Loans create deposits and generate reserves at the Fed. The Fed creates the reserves on demand as part of the federal payments system. If not able to access reserve funds from other commercial banks on the interbank market, a bank can always access reserves from the Fed at the FFR. The interbank rate is shown in the chart below and shows that at present commercial banks would be better off obtaining their required reserves from the Fed discount window at 2.5% rather than the current 2.6% interbank rate.
(Click on image to enlarge)
Every 0.25% rate movement changes the cost of loan funds by $10 billion. The private banks then pass on this rate change to the customer if they can.
An FFR increase is a giant, economy-wide tax on borrowers and lenders. Each time the Fed raises 0.25%, it moves $10 billion from the private sector to the government sector.
Interest Burden On Private Debt
The following table shows the impact of the rate on the stock of private debt in absolute terms and as a percentage of GDP.
(Click on image to enlarge)
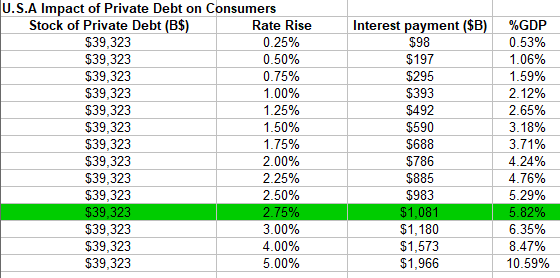
The chart shows that with each 0.25% FFR rise, $98 billion, or 0.53% of GDP, is transferred from the household and business sector to the finance sector in a macro intersectoral income transfer.
Treasury Deposits
Another impact of a rate change is on Treasuries (also known as government debt). If there is a general rate rise, then the yield on Treasuries will also rise as new Treasuries issue at the new higher rate, and existing ones trade on secondary markets for lower face values.
Under current institutional arrangements, governments around the world voluntarily issue debt into the private bond markets to match $-for-$ their net spending flows in each period. A sovereign government within a fiat currency system does not have to issue any debt and could run continuous fiscal deficits (that is, forever) with a zero public debt.- Source: Professor William Mitchell, 2015
The following table shows the generalized impact of the rate rise on the stock of Treasuries.
(Click on image to enlarge)
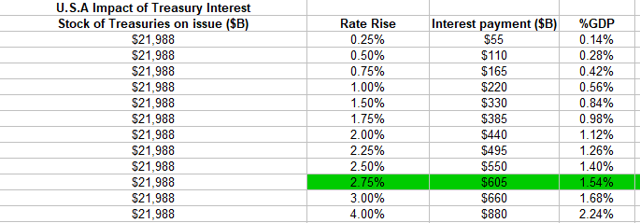
(Source: Author calculations based on Trading Economics Government Debt measure)
The table above shows that with each 0.25% rate rise, some $55 billion of new money enters the private sector from the government sector. The positive side of the equation is that more dollars in the economy grow the economy.
Treasuries have come down this month as compared to last to reflect the collection of tax. It is thus enabling the government to stay under its artificial voluntary budget constraint known as the "debt ceiling".
I estimate from the change in the level of Debt Subject to Limit from last month to this month that the tax take in April was around $600B, which is about the largest ever.
The trade deficit is about -$70B and so this air pocket of liquidity shortage should hit the market one month later in the middle of May (SPY), (DIA), (QQQ) and provide good buy the dip opportunity. Until then stay in bonds (TLT) or cash (UUP) to ride out the volatility. Trump's trade antics should heighten any peaks or troughs along the way by adding a sentiment factor that might not otherwise be there.
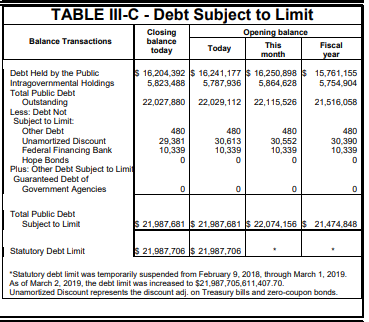
Below is the end month treasury statement for March, note that the government is over its debt limit for the month, see the column marked "This month".
(Click on image to enlarge)
(Click on image to enlarge)
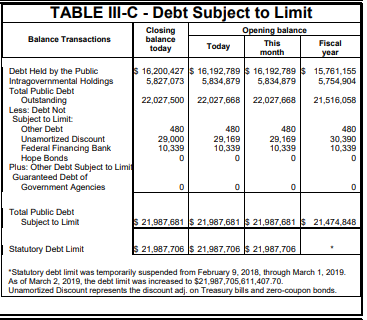
Above is the end of month treasury statement for April showing the government back under the debt ceiling.
This juggling of treasury issuance is hampering the Fed and Treasury in the maintenance of the FFR. The Treasury has its hands artificially tied and the Fed must at present work almost alone.
Interest on Excess Reserves
This is the factor that the Fed did change at the last meeting.
A phenomenon coming out of the 2007 Global Financial Crisis (GFC) boom/bust was the Federal Reserve would pay interest on excess bank reserves (IOER) held by commercial banks that had beforehand received no interest payment. This aspect gets almost no press coverage, and yet, the implications are enormous.
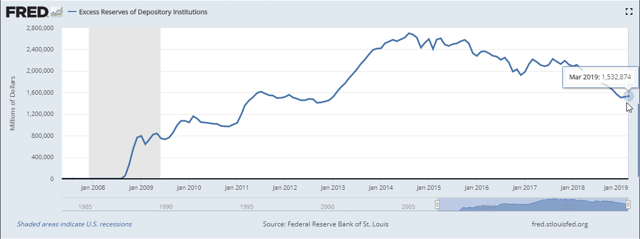
The chart below shows the stock of excess bank reserves.
(Click on image to enlarge)
The chart below shows the interest rate paid on excess bank reserves.
(Click on image to enlarge)
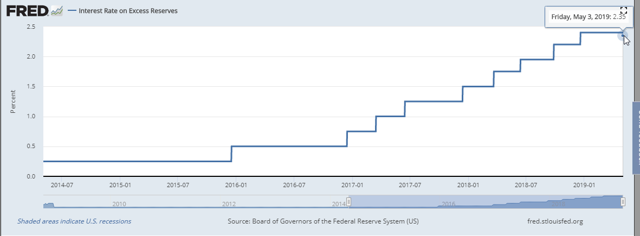
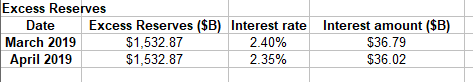
One can see how it has moved from 2.4% to 2.35%.
The table below shows the official rates set by the Fed.
One can see that the interest on excess reserves mirrors the FFR closely. The implications of this are twofold:
1.) The FFR will never fall below the IOER; the IOER is a support rate that sets a floor under interest rates. The implication is that instead of setting a target rate and selling and buying Treasuries to achieve the target rate, the same objective is achievable by fixing the support rate where the central bank wanted it to be.
2.) Banks receive free money. There are over $1.5 trillion of excess reserves sitting in the reserve accounts of US banks, and this earns them $36 billion per annum of income. Again, this is money created by marking up bank accounts, and is, therefore, high-powered sovereign money as opposed to debt-based credit money.
The rate has fallen, and the table below shows the impact of this change.
(Click on image to enlarge)
(Source: Author calculations based on Trading Economics Government Debt measure)
This income adds to the bank's capital base, which, in turn, means it can increase its lending if creditworthy borrowers wish for a loan, or it could be paid out in dividends, stock buybacks or excessive executive remuneration.
On Balance, What Does This All Mean?
There are winners and losers from changes to Fed policy. In this instance:
Banks - The banking sector loses $1B of annual interest income
Borrowers - Should have no impact unless the banks pass their lost income onto customers in the form of higher rates and fees.
The macro-economy
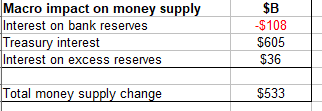
The following table shows the impact on the macro money supply.
(Click on image to enlarge)
(Source: Author's calculations based on FRED statistics and Trading Economics dot com statistics)
As a result of the Feds actions, macro income has dropped $1B with the banking sector now receiving less interest income from excess reserves.
The Fed increases its income profits by the same amount which it then largely remits to the US Government as a dividend. Because the US Government is the monopoly manufacturer of the US dollar this is akin to returning water to the sea or sunlight back to the sun.
The net result is that banks have $1B of reduced income and the macroeconomy shrinks by the same amount.
Interest income from treasuries has fallen by $1B due to the lower level of treasuries on the issue due to the debt ceiling reduction accounting.
The total macro shrinkage from the last meeting is $2B overall.
While this is a real and tangible change, it is unlikely to have any impact on markets given its relatively small size at the macro level.


Fantastic article, Alan. Thanks for sharing.
Agreed.
Thanks Robert.
Hello,
The pre-meeting report is here: seekingalpha.com/.../4254418-fed-meeting-april-30-may-1-2019-impact-rate-rise