
Wage Growth - Strongest Production Non-Supervisory Since 2009
Wage Growth - December Wage Growth Was Strong
The December labor report was strong across the board. Specifically, construction added 38,000 jobs, retail trade added 24,000. Trade & transportation added 34,000, and professional & business added 43,000 jobs.
Average hourly earnings growth was 0.4% month over month which beat estimates for 0.3% and last month’s reading of 0.2%. Average hourly earnings growth was 3.15% year over year as you can see from the chart below.
This beat estimates for 3% growth and last month’s reading of 3.13%. As you can see, without rounding, the increase is only 2 basis points. The recent high was 3.17% in October. That was the highest growth this cycle.
(Click on image to enlarge)

As always, I will review the length of the work week to see if the hourly wage growth translated to more take-home pay.
The average work week was 34.5 hours which met the consensus and was above last month’s 34.4 hours. This all translates to average weekly earnings growth of 3.15% which is much higher than the 2.83% growth in November, but below the 3.47% growth in October.
Wage Growth - October’s growth was the fastest of this cycle.
Earnings growth should be making new cycle highs because the labor market is tighter than at any point since the recession. Wage growth hasn’t met previous cycle peaks. There are still prime age workers without jobs that normally have them at the end of the cycle.
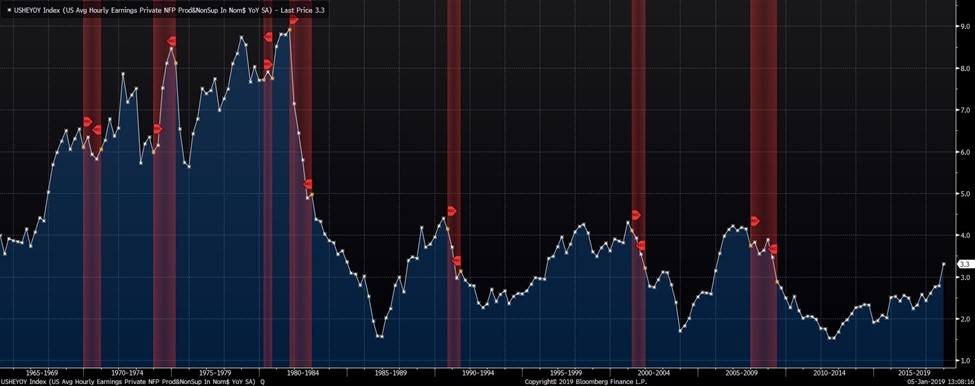
Even though I’ve shown a lot of positive metrics from this report, the best one is shown below.
As you can see, the average hourly wage growth for production and non-supervisory workers is 3.3% which is the highest this cycle. This is the highest growth since April 2009. The previous cycle high was December 2006 at 4.2%. Growth rate is still 0.9% away from the previous peak and that peak occurred one year before the last recession.
This is another labor market indicator which suggests a recession is over one year away.
(Click on image to enlarge)
Wage Growth - Do People Want Jobs?
The chart below breaks down the decrease in the number of unemployed people by those who say they want a job now and those who say they don’t want a job now.
In the past 3 years, the percentage of prime-age workers with jobs is up 2.3%. 0.4% of that increase is from those who want a job now. The rest of the increase is from those who don’t want a job.
The obvious question here is why anyone would get a job if they don’t want one. My best explanation is wage growth is encouraging people who don’t want to work, to change their mind.
Wage Growth - Everyone has a price they will work for. Higher wages encourage more people to look for work.
Plus, when the labor force is full, employers offer job training to those who lack experience.
Someone might say they don’t want a job because they don’t think they can get one. When they see the possibility of getting one with little experience, they might change their mind.
As you can see, the percentage of prime-age workers who don’t want a job is higher than previous cycles. These potential workers are where employers need to look if they are desperate to fill roles.
One other point about the green line in the chart below is that more people may be in school now than in the past two cycles. This is focusing on people 25-54, but some people may still be getting their master’s degree in this age bracket.
(Click on image to enlarge)

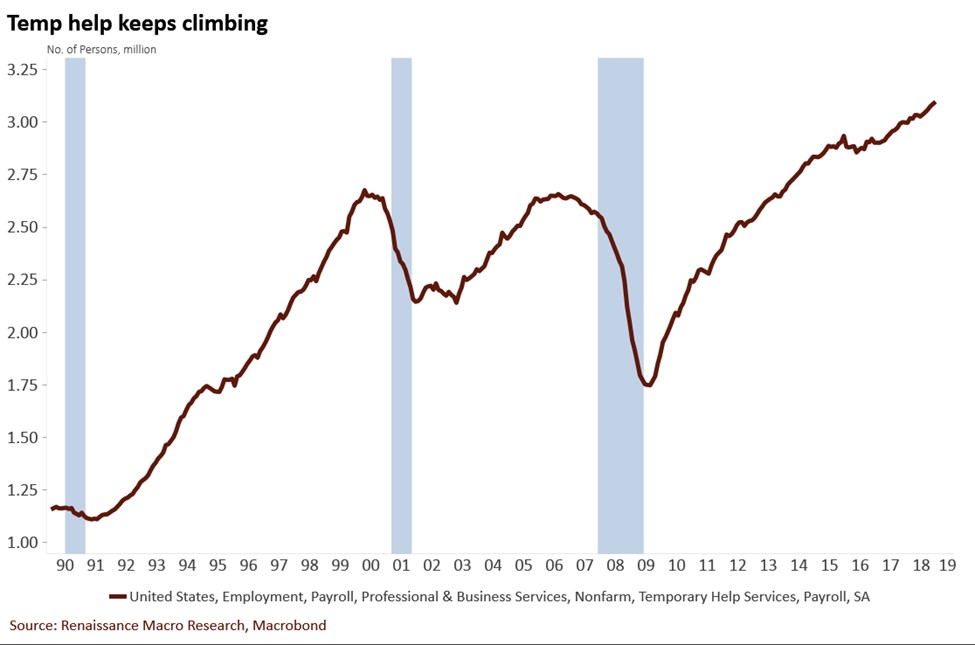
Wage Growth - Highest Temporary Workers Ever
Temporary workers are easy to fire when the economy starts to falter. You can see in the chart below that temp hiring stalls before recessions.
Temp hiring isn’t stopping now as it is at a record high. In December, 10,000 temporary workers were hired. Temporary workers are popular because firms are having a tough time filling empty positions.
Some temporary workers are being asked to do more because the labor market is tightening.
(Click on image to enlarge)
Wage Growth - Where Workers Are Coming From
Reviewing the slack in the labor market is critical because many economists have been falsely claiming that the labor market has been full for the past few years.
It’s wrong to take a cursory look at the unemployment rate and assume the labor market is full. People are coming back to the labor market after being on the sidelines for years.
As I mentioned earlier, people who don’t even want a job now are getting jobs.
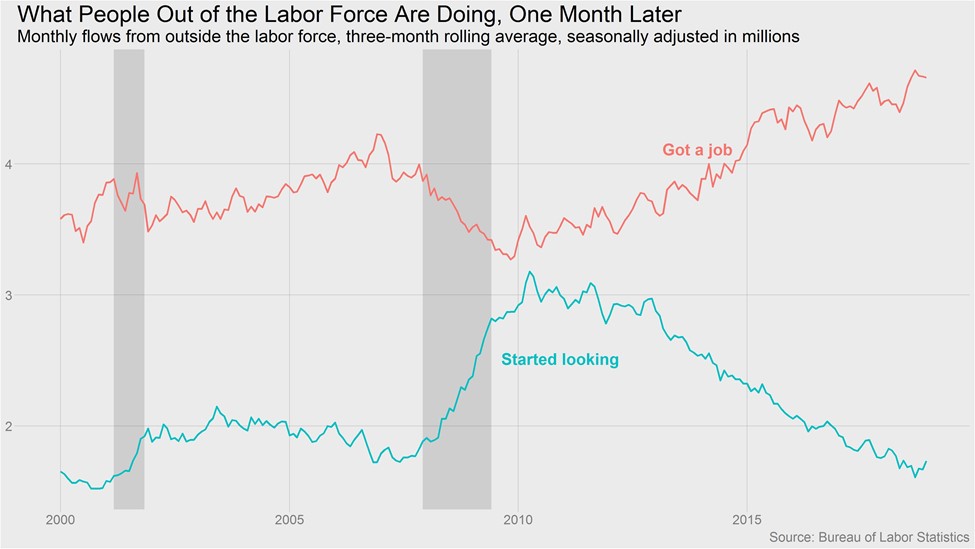
The chart below shows the 3 month moving average of job flow. As you can see, this chart breaks down what unemployed people are doing one month later.
More people are getting jobs than ever in nominal terms which makes sense because the labor market is growing. The number of people who are just starting to look for a job is low because this expansion has been almost the longest since the 1800s. Recent slight increase in the number of people starting to look could be the people who previously didn’t want a job. It’s probably not people who were recently fired since the jobless claims are low.
(Click on image to enlarge)
The last chart below shows the number of people entering the labor force. That decline in 2016 indicated there weren’t as many people coming off the sidelines. This slight uptick in the past few months indicates there might be a turnaround which would add slack to the labor market which would extend this business cycle.
(Click on image to enlarge)

Wage Growth - Conclusion
Government economic reports aren’t coming out because of the shutdown which is now the 2nd longest in history.
The stock market usually isn’t hurt by shutdowns because they are short-lived and are political theater. The only issue is we don’t have as much economic data to review.
Luckily, we got the December labor report which was excellent. As I showed in this article, people are coming back into the labor force and production & non-supervisory workers are getting a big boost in their wages.
Even as some bears claim a recession is coming this year, American workers are doing really well.
Disclaimer: Neither TheoTrade or any of its officers, directors, employees, other personnel, representatives, agents or independent contractors is, in such capacities, a licensed financial ...
more

