
The Macroeconomics Of Degrowth
Written by Steve Keen, Patreon.com/Steve Keen
Can planned economic contraction be stable?
The Limits to Growth (Meadows, Randers et al. 1972) is infamous for many things, but above all for its "Standard Run" scenario, which predicted that, if there were no changes to the direction of economic development after 1972, then by some time in the early to mid-21st century, human civilisation would undergo a serious decline.

Figure 1: The Limits to Growth standard run (Meadows, Randers et al. 1972, p. 124). The legend for all plots is provided in Figure 2
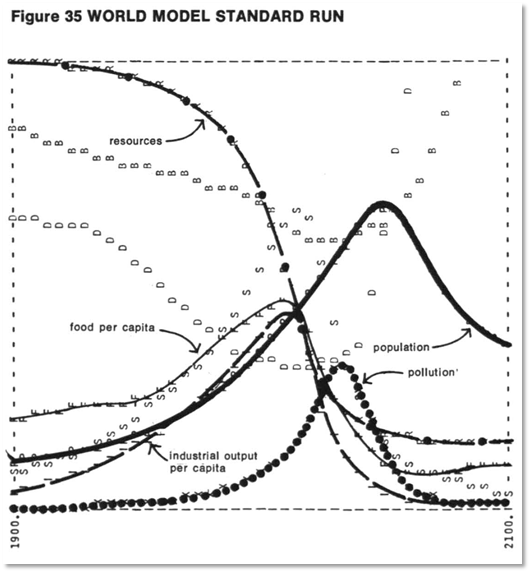
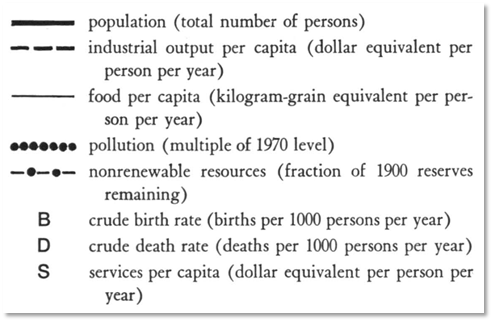
Figure 2: The legend for all the Limits to Growth plots (Meadows, Randers et al. 1972, p. 123)
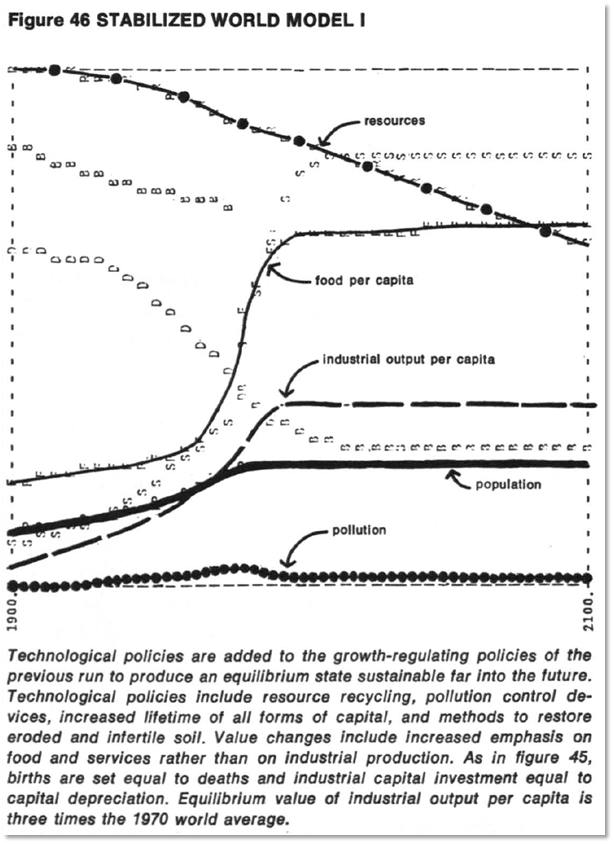
Less well known is its stabilised run, in which a range of policies were hypothetically introduced in 1975 to achieve a state of "global equilibrium ... so that the basic material needs of each person on earth are satisfied and each person has an equal opportunity to realize his individual human potential" (Meadows, Randers et al. 1972, p. 24). The simulation concluded that no single policy was sufficient: population control on its own was not enough, nor pollution abatement without population control, and so on. But if all the policy changes they modelled were undertaken (they are described in Figure 3), then the world could achieve a sustainable future where average living standards for the globe as a whole were three times as high as they were in 1970 - and much more equitably distributed.
Figure 3: The state of global equilibrium run (Meadows, Randers et al. 1972, p. 165)
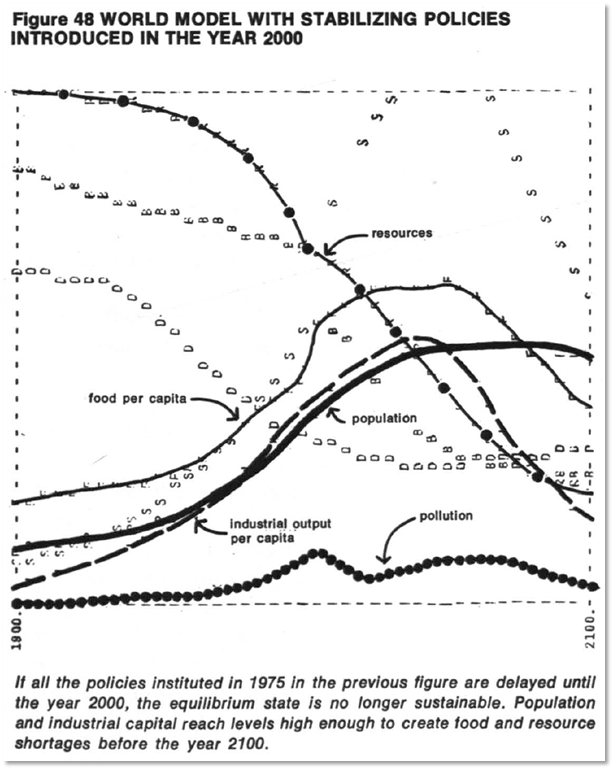
As crucial as the need for a swathe of coordinated policies was the timing: if the changes were delayed for another 25 years till 2000, then they would fail: there would be overshoot of the biosphere's capability to endure the pressure put upon it by humanity's industrialized society. Both output and population would reach a peak in the mid-21st century and then decline.
Figure 4: Policies for global equilibrium introduced in 2000 instead of 1975 (Meadows, Randers et al. 1972, p. 169)
It is stating the obvious that policies to restrain humanity's pressure on the biosphere were not put in place in 1975, nor 2000, nor even 2020. With research by Graham Turner (Turner 2008; Turner, Hoffman et al. 2011; Turner 2014) confirming that the world is still largely tracking the Standard Run of Limits to Growth, and studies like the Human Ecological Footprint (https://www.footprintnetwork.org/resources/data/) asserting that the human species alone is using 1.6 times the reproducible limit of the biosphere, we are well into ecological overshoot. Meadows et al noted that there were only three possibilities for the future, and that only two were possible:
All the evidence available to us, however, suggests that of the three alternatives - unrestricted growth, a self-imposed limitation to growth, or a nature-imposed limitation to growth - only the last two are actually possible. (Meadows, Randers et al. 1972, p. 168)
Since we have clearly failed to impose limits ourselves, we now face Nature doing that for us. Meadows et al deliberately avoided providing precise timing for their predictions, stating that:
We have deliberately omitted the vertical scales and we have made the horizontal time scale somewhat vague because we want to emphasize the general behavior modes of these computer outputs, not the numerical values, which are only approximately known. (Meadows, Randers et al. 1972, pp. 123-24)
However, it is hardly being hyperbolic, at this point in 2020 - with Australia's wildfires behind us (Dowdy, Ye et al. 2019), Covid-19 all around us (Korolev 2020), India and Bangladesh suddenly reeling under the impact of Cyclone Amphan, and the prospect of catastrophic wildfires in the approaching American Summer - to feel that the deliberately vague timing of the Limits to Growth has proven to be precisely correct. Nature may be imposing its limits now.
But just as Covid-19 has severely jolted our consciousness, and led to policy changes that were unthinkable as recently as January 2020, what if these and subsequent ecological calamities shook humanity so much that we decided, belatedly but instantly, to impose the limits that Limits to Growth recommended we should implement 45 years ago? What would happen to global GDP?
Answering this question thoroughly would require updating the Limits to Growth study with current data. This should have been happening on a regular basis since 1972, but it was prevented in large measure by the ferocious attacks on the study's credibility by economists in general - and by William Nordhaus in particular (Nordhaus 1973; Nordhaus 1992). These attack were based on misinformation and ignorance rather than knowledge (Forrester, Gilbert et al. 1974), but - or should I say "and"? - their impact was devastating. Though the book itself sold millions of copies, the group's research funding evaporated. Whereas the original study was run on top of the line (for the time) mainframe computers at MIT, with a budget of the order of a million dollars in 1972, today Jorgen Randers, one of the authors of the original study, is working without pay on developing an extended version of the World3 model called MODCAP (using the PC-based system dynamics program Vensim). In 2019 he was unable to raise funds to continue employing his one assistant.
In lieu of a complete answer therefore, I will provide a partial one by focusing on one of the many weaknesses of economics: the failure of both mainstream and non-mainstream economists to properly acknowledge the essential role of energy in production. What will happen to GDP if humanity realises that it has to immediately cease adding CO2 to the atmosphere, by ceasing to use carbon-based forms of energy, for everything from the production of electricity to transportation?
This question can't be answered by turning to an unconventional economics textbook, let alone a conventional one. To date, Post Keynesian and Neoclassical economists alike have modelled GDP as being generated by a combination of labour and capital: Labour and Machinery in ---> Goods and services out. Some economists have attempted to incorporate energy by, to use Neoclassical terminology, treating Energy as a third "factor of production" on an equal footing with Labour and Capital (Solow 1974; Stiglitz 1974; Stiglitz 1974). But this is ontologically false. Energy cannot be added to a production process independently of labour and capital, and nor can a worker or a machine function without energy inputs. As I put it in "A Note on the Role of Energy in Production":
Labour without energy is a corpse; capital without energy is a sculpture. (Keen, Ayres et al. 2019, p. 41)
This perspective casts the relationship between energy and GDP in a very different light to conventional economics, which even Larry Summers ridiculed for treating energy as no more important than its very small share of total GDP implied (less than 10% for most countries):
There'd be a set of economists who'd sit around explaining that electricity was only four percent of the economy, and so if you lost eighty percent of electricity you couldn't possibly have lost more than three percent of the economy ... It would be stupid. And we'd understand that somehow, even if we didn't exactly understand in the model, that when there wasn't any electricity there wasn't really going to be much economy. (Summers 2013)
Treating energy as inputs to both labour and machinery (in different forms of course) implies a critical relationship between energy inputs and GDP: if there is no energy input, then there is no GDP, and if energy inputs fall, then ipso facto, so will GDP.
There are only two ways in which these implications could be countered: if there was over time a trend for GDP to "decouple" from energy, so that more GDP was produced per unit of energy; and if there was a strong trend for renewable forms of energy to replace carbon-based forms, so that the overall fall in energy could be attenuated.
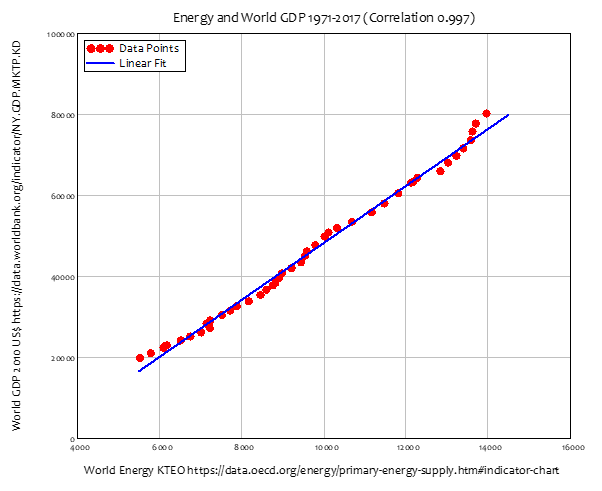
Both these counters are false hopes. Though there has been a trend to a falling level of energy per unit of GDP in some countries, at the global level, the relationship between energy consumption and GDP between 1971 and 2017 is stunningly linear - see Figure 5. A rising global GDP requires a rising level of energy, and since energy is the motive force, if we are forced to abandon carbon-based energy forms, then GDP has to fall by much the same fraction as carbon-based energy is of total energy.
Figure 5: The relationship between global energy and global GDP between 1971 and 2016 (see note at end of post)
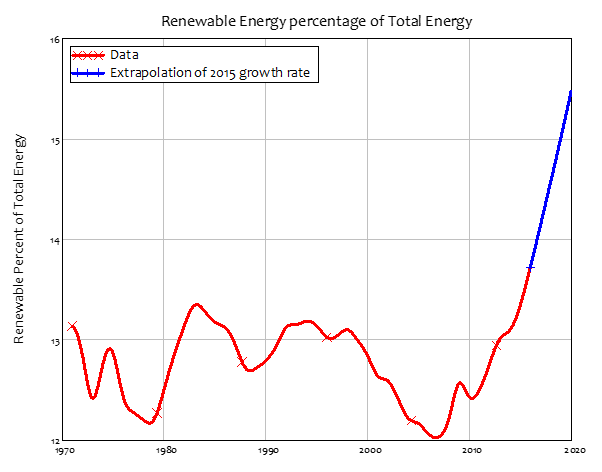
The remaining hope is that progress in renewable energy has been such that it makes up a much larger proportion of total energy production than in the past. But again, the data dashes hope: though there has been a rapid increase in renewable energy as a percentage of total energy production since 2007, by 2016, it had only just pushed the renewable percentage past the peak it reached in 1983 - see Figure 6. Even if the trend during 2015 had continued, renewables would still constitute less than 16% of total energy output in 2020.
Figure 6: The disappointing news on renewables as a percent of total energy supply
That implies that, if we decided to cease using carbon-based fuels at all at the end of 2020 - so that we stopped adding to the level of CO2 in the atmosphere - then GDP would fall by about 85%.
There is no way that such a decision will be made in 2020 - or at least, no way it will be made voluntarily. As Covid-19 has shown, a decision of a comparable magnitude can be compelled by Nature, but the mentality amongst decision-makers and the public is still to aim for a "return to normal" when - or rather if - the Covid-19 threat is contained.
But what if the wildfires, and the virus, and the floods, and the locusts(!) of 2020 are just the beginning of a series of ecological nightmares that will finally alert humanity to how far we have overstepped the carrying capacity of this planet? What if policymakers, with not merely the support of the public but pressure from it, adopt the UK Labour target of 2030 as the year in which CO2 emissions fall to zero? Given the linear relationship between energy usage and GDP shown in Figure 5, what would it take in terms of the replacement of carbon-based energy sources by renewable ones - primarily solar and wind - to preserve 2020's global real output level in 2030?
Extrapolating the trends in both GDP and Energy from 2016 to 2020 yields an estimate of global GDP in 2020 of $86 trillion (in 2010 US$ terms), and energy production of 14 million KTOE (KiloTonnes of Oil Equivalent, one of the standard measures of energy). If we assume that, as of 2020, renewable energy is providing 15% of total energy, then to reach 100% renewable energy by 2030 - and thus achieve zero emissions of CO2 - while maintaining GDP at the 2020 level, would require the installation of renewable energy sources capable of yielding the energy equivalent of roughly 12 billion tonnes of oil every year.
To put this in perspective, to generate the same amount of power from large (1,000 Megawatt) hydro-electric or nuclear power stations in 2030 would require building 16,000 of them between now and 2030, or more than 4 such stations per day, every day. It goes without saying that we do not have the capacity to achieve either goal.
Solar cells and wind farms are technologically far less complicated than nuclear power stations, and capable of being installed in far more locations than hydroelectric dams. However, solar only generates power during daylight hours, wind farms are more restricted in location, and both require an enormous area to generate the same power as a nuclear or coal-fired power station. Since the energy the Earth's surface receives from the Sun peaks at about 10 Megawatts per hectare, a 1000MW solar power station would require roughly 1,000 hectares of land with optimistic assumptions about efficiency and availability (wind power is even more diffuse). To completely replace our planetary energy production with solar power would require an area of solar panels roughly equivalent to one third the area of Spain.
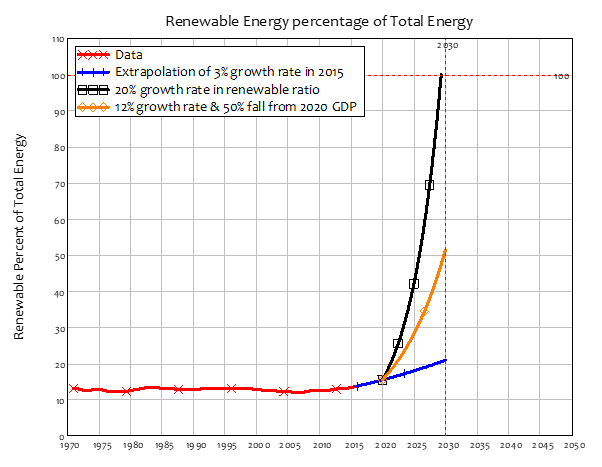
That amount of land could be provided by the world's road networks and rooftops, with farms also hosting wind generation, so the goal is not unreachable. But are we getting to this goal fast enough, so that by 2030, renewable energy could provide 100% of our energy needs? Unfortunately, no - and not by a long shot. The red and blue plots in Figure 7 are the same as in Figure 6, just with the time horizon pushed further out: at the current growth rate of renewable energy, it would take until 2082 to achieve 100% renewable energy at the 2020 level of GDP. To get to 100% renewable energy by 2030 and thus be able to sustain 2020's real GDP level, we need a growth rate of the renewable (predominantly wind and solar energy) to total energy ratio of 20% per year - almost seven times as high as the actual growth rate in 2015. Call me a pessimist, but I can't see that happening. Individual countries (such as the UK) might be able to get there, but at the planetary level, we will not.
This means that we won't be able to maintain 2020 GDP levels in 2030 with an economy which is completely powered by renewable energy, and hence has net zero CO2 emissions. Though we should endeavour to expand renewable and non-carbon-based power in general as much as possible, if we are to have a zero carbon economy by 2030, then we have to accept that GDP will fall substantially. Even a four-fold increase in the rate of growth of renewable energy will result in energy input levels - and hence GDP output levels - that are 50% below 2020 levels in 2030.
Figure 7: Extending the optimistic extrapolation of the trend in Figure 6 till it reaches 100% of energy production
How could such a reduction in output be undertaken deliberately and, as much as possible, peacefully? We need a mechanism for GDP reduction, and for the encouragement of the shift to renewable energy, that falls primarily on the wealthy. A price for carbon, as championed by Neoclassical economists like William Nordhaus, will afflict the poor disproportionately compared to the rich. The riots with which the Gilles Janes movement began in France in response to carbon pricing less than 2 years ago should make it obvious that the burden of adjustment must fall on the rich rather than the poor - both within nations and between them.
One system that could work is a dual-price mechanism based on carbon rationing, as proposed by Total Carbon Rationing. Currently, for other reasons, many Central Banks are exploring the concept of "Central Bank Digital Currencies" (CBDCs), which would give every resident in a country an account at the Central Bank. Rather than being a means to create and store the national currency, these accounts could be used to provide a "Universal Carbon Credit" (UCC) to every resident of a country on an equal per capita basis per recipient - so that billionaires would receive the same annual UCC as paupers. To buy any commodity, a consumer would need to pay both its money price, as now, and its CO2 content as well, using UCCs.
The ration could initially be set well above the average per capita CO2 consumption of the country, so that the vast majority of the population would never exhaust their allowance, and would therefore be able to sell their excess UCCs to the rich - who, at their current consumption levels, would definitely exhaust their allowance, and thus need to buy UCCs from the poor. It would work as a redistributive mechanism, as well as a means to reduce consumption and hence GDP and CO2 output as it was reduced over time.
An economically and politically stable route to reduced GDP is thus conceivable. Is it realistic? My expectation is that it is not. The far more likely outcome is that humanity in general and the powerful in particular will delay the decision to act, hoping instead that GDP can return to pre-Covid-19 growth rates, while ignoring the dependence of this growth rate on an increasing use of carbon-based energy that will accelerate Global Warming. We will, in effect, let Nature make the decision for us.
References
Dowdy, A. J., H. Ye, et al. (2019). "Future changes in extreme weather and pyroconvection risk factors for Australian wildfires." Scientific Reports 9(1).
Forrester, J. W., W. L. Gilbert, et al. (1974). "The Debate on "World Dynamics": A Response to Nordhaus." Policy Sciences 5(2): 169-190.
Keen, S., R. U. Ayres, et al. (2019). "A Note on the Role of Energy in Production." Ecological Economics 157: 40-46.
Korolev, I. (2020). Identification and Estimation of the SEIRD Epidemic Model for COVID-19, SUNY at Binghamton, Department of Economics.
Meadows, D. H., J. Randers, et al. (1972). The limits to growth. New York, Signet.
Nordhaus, W. D. (1973). "World Dynamics: Measurement Without Data." The Economic Journal 83(332): 1156-1183.
Nordhaus, W. D. (1992). "Lethal Model 2: The Limits to Growth Revisited." Brookings Papers on Economic Activity(2): 1-43.
Solow, R. M. (1974). "The Economics of Resources or the Resources of Economics." The American Economic Review 64(2): 1-14.
Stiglitz, J. (1974). "Growth with Exhaustible Natural Resources: Efficient and Optimal Growth Paths." The Review of Economic Studies 41: 123-137.
Stiglitz, J. E. (1974). "Growth with Exhaustible Natural Resources: The Competitive Economy." Review of Economic Studies 41(5): 139.
Summers, L. (2013). Larry Summers at IMF Economic Forum, November 8th 2013.
Turner, G. M. (2008). "A comparison of The Limits to Growth with 30 years of reality." Global Environmental Change 18(3): 397-411.
Turner, G. M. (2014). Is Global Collapse Imminent? An Updated Comparison of The Limits to Growth with Historical Data. Melbourne, Melbourne Sustainable Society Institute.
Turner, G. M., R. Hoffman, et al. (2011). "A tool for strategic biophysical assessment of a national economy - The Australian stocks and flows framework." Environmental Modelling & Software 26: 1134-1149.
NOTE
As was pointed out on Twitter, this relationship can't hold for the distant past (which I wasn't considering here). I've since added GDP data back to the year Dot and energy data till 1800 (using Angus Maddison's and the Netherland's PBL data sources respectively), and done a log-log plot (which shows proportional change). The resulting relationship derived from 1971-2019 data holds right back till 1930, when there's a clear structural break that could perhaps be related to the change from a coal-dominated economy to an oil-dominated one.

This is the draft of an invited chapter in a forthcoming book Post Capitalist Futures, to be published by Palgrave. Since I make several references to the Limits to Growth study, I've attached a PDF of that much-maligned and prescient study to this post, as well as Graham Turner's 2014 paper showing that the "standard run" of Limits closely matches the 40 years of data since the publication of Limits in 1972.
Disclaimer: No content is to be construed as investment advice and all content is provided for informational purposes only. The reader is solely responsible for determining whether any investment, ...
more

