
The Key To High Returns: Ignoring All The Data
- The economy and the stock market are two different entities, but the impact that one has on the other is extremely important.
- The stock market has trended upward since its December lows.
- The hard data shows slowdowns, consumer sentiment is waning, but the market continues higher.
- The market trends to the upside over time, and getting exposure to the positive drift is beneficial for portfolios.
Economic reports have been delayed. The government exited a 35 day shutdown a few weeks ago, and are expected to enter another one February 15th if things don't get resolved. March 2nd is the final day to figure things out with China, or tariffs go up to 25%. To say that there is uncertainty would be an understatement.
We can look into the data to determine what has happened, and potentially what will happen. Most key metrics are contracting, and the impact of the tax cut is beginning to wear off. The market appears to be recovering from it's 2018 December fall, but indicators are pointing to an earnings recession and a dry-up of growth, domestically and internationally.
Economic Indicators: What are the Data Saying?
The US Leading Index is composed of housing permits, unemployment insurance claims, ISM data, and the spread between the 10-year and 3-month, among other leading variables for the economy. The rate is 0.98%, which is the lowest it has been since November 2009. The lower rate reflects a potential slowdown in growth for the US coincident index.
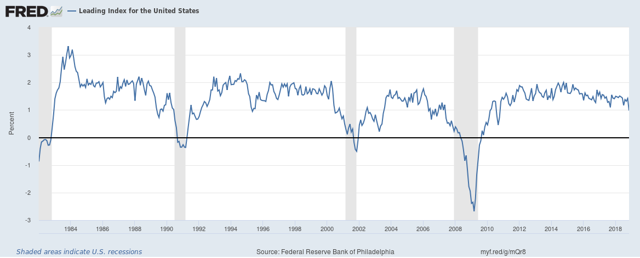
Source: FRED
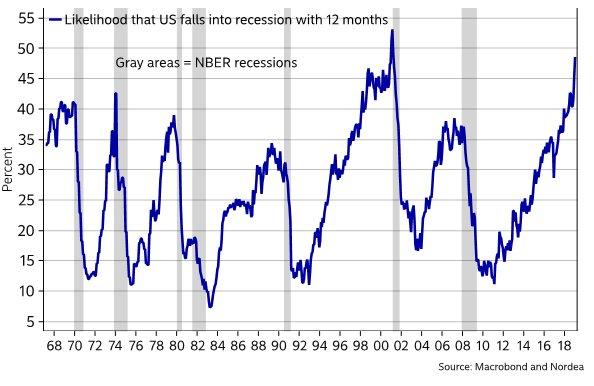
Several models have also reflected this potential slowdown, with some factoring in the probability of a recession over the next 12 months. Nordea Bank found that there is a 49% likelihood of a recession in the next 12 months, based on the differential between expected consumer confidence and current conditions.
Source:
The Number Most Discussed: Gross Domestic Product
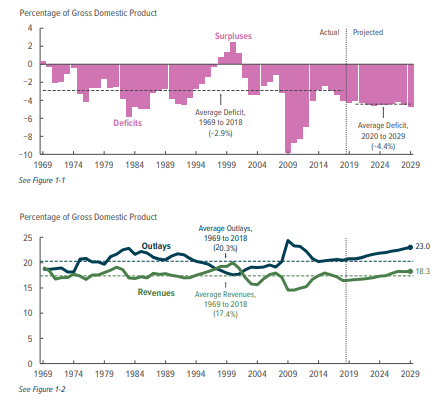
GDP has been slowly contracting in growth over the past two quarters, but still remains positive on a year-over-year basis. But GDP as a standalone isn't always the most useful metric. It's also important to consider how the GDP relates to the deficit. For the next ten years, deficits are supposed to average 4.4% of GDP, which is more than 1.5x larger than the 50 year average of 2.9%. Revenue is expected to increase, representing 18% of GDP, but so are outlays, at 23% of GDP. There is a 4.7% gap between the incoming dollars and outgoing, which will further increase the deficit and raise debt.
Source:
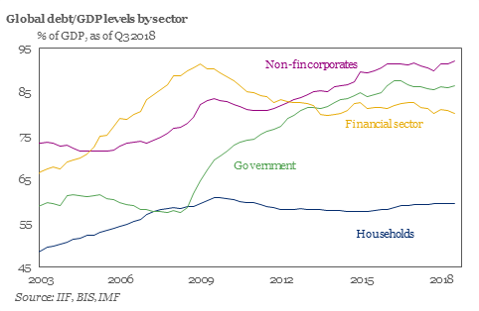
But it's not just the US that is weighed down by debt, although the new $22 trillion metric is rather concerning. In Q3 2018, global non-financial corporate debt hit a record high of 92%, according to the IIF. A lot of this debt increase was driven the United States, but China has also taken out their fair share of credit. Both countries also have interest coverage ratios below optimal levels. Global debt has grown by $27 trillion since 2016, surpassing $244 trillion and 318% of GDP.
Source:
Fiscal Policy: No Benefit From Cutting Taxes
Corporations are not excluded from this debt phenomenon. Corporate debt has been increasing at unprecedented rates, with most companies leveraging themselves beyond the point of sustainability.
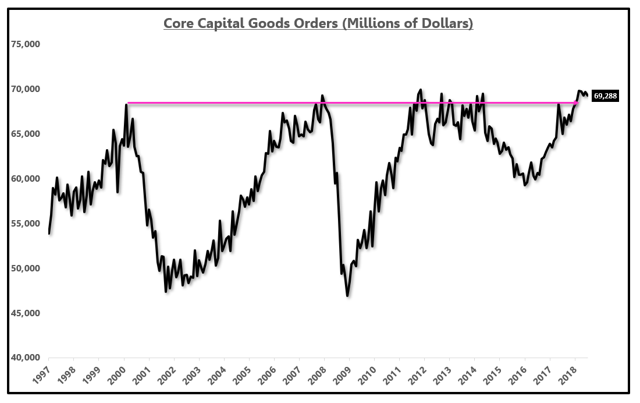
84% of respondents to the NABE Survey of Business Conditions said that they had no plans to change hiring or investment with the savings from the tax cut, which will pose problems for future growth. Most of the companies used the money on share buybacks. Capital investment has been weakening for a long time, and there has been zero growth since the early 1990s. Capital goods orders fell to 1.45% in 2018, falling from 13% growth in 2017.
Source:
Monetary Policy: Avoiding Rate Hikes
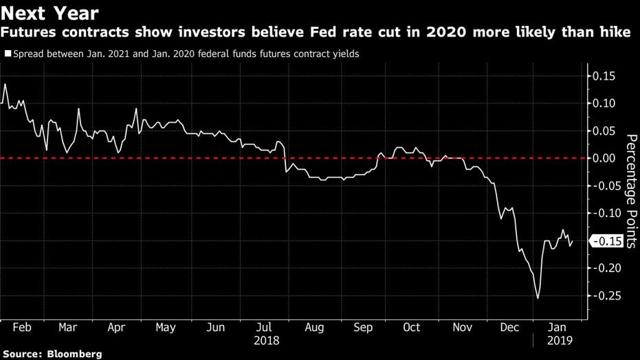
When the Fed attempted to raise rates, the market responded negatively. We went eight years without a rate increase, and are still far below pre-2008 levels. In their last meeting, the Fed basically said that they were on hold, practicing patience and flexibility. Futures contracts started to price in a cut for 2023, with a cut more likely than a hike in 2020, although neither are statistically significant.
Source: Bloomberg
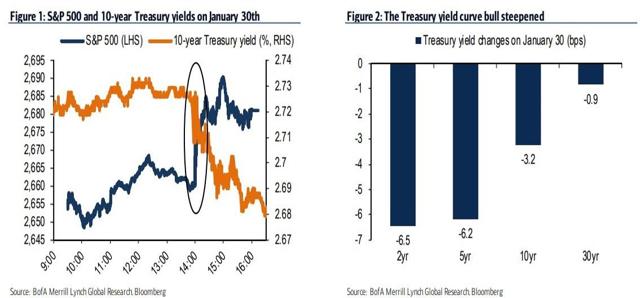
Any signs of hawkishness that Jerome Powell once showed are completely gone. When he announced his message of patience, the stock market rallied, credit spreads went higher, the curve steepened, and the dollar declined in response. The Fed Put is very real.
Source:
The Fed has also been attempting to shrink its balance sheet at a rate of $50 billion a month. At the most recent meeting, Powell also said they were willing to be flexible in this process as well. The balance sheet is down from it's peak of $4.5T, currently hovering around $4.1T. But the plan was to shrink it to less than $3T, a process that keeps on getting pushed out more and more into the future.
The Slowdown in the Housing Market
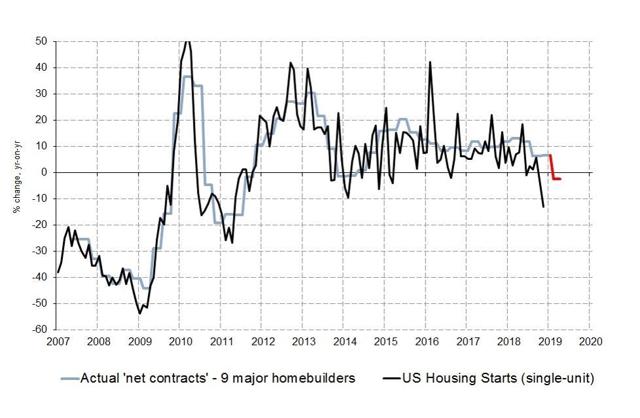
The rise in rates also affects the housing market. The gap between starts and contracts has widened over the past few months. People are planning to build out homes, but the number of starts is declining. According to the National Association of Realtors, the number of pending home sales has declined almost 10% on a year-over-year basis. People aren't building, and people aren't buying.
Source:
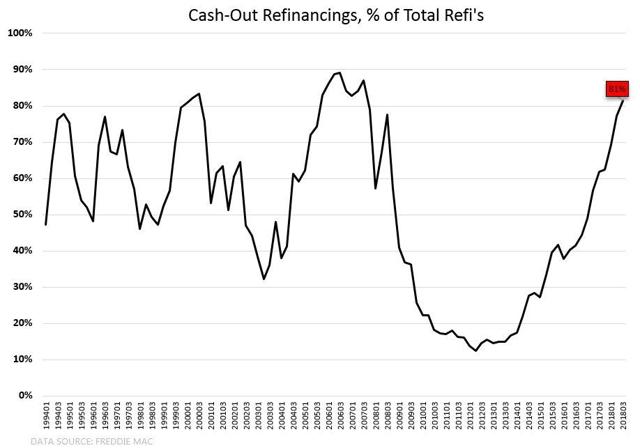
Those who do have homes are increasingly using those homes for cash, which isn't sustainable. Factoring interest expense and credit card payments, consumers are going to be strapped for cash soon. They are currently paying $110 billion in credit card interest, which is a 45% increase from 2014 numbers.
Source:
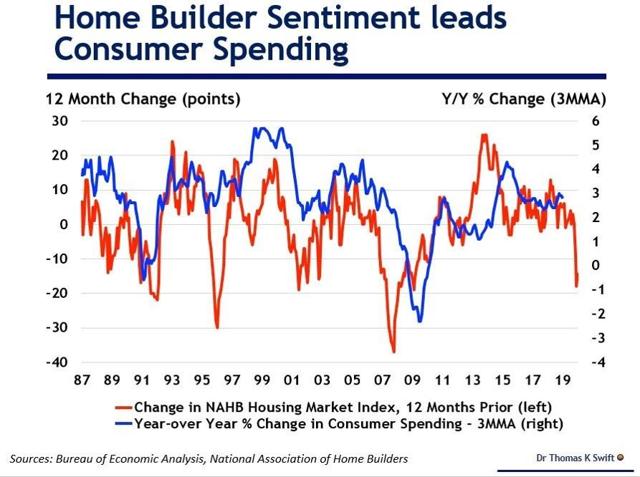
There is a large interaction effect between home builder sentiment and consumer spending. Housing often seems to be the first thing that gets hit when the economy starts to weaken. The below graph gives an idea of what might happen if the two continue to track closely. The NAHB Housing Market Index just had a steep drop, and based on history, consumer spending will too.
Source:
Consumer spending itself is moving along on a slow, but steady pace. Real personal consumption rose 0.3%. Personal disposable income rose 0.2%, and the personal savings rate declined to 6%. The labor market itself is strong, by nominal standards. Unemployment as measured by U3 is still near all-time lows, and U6 is relatively unchanged.
Looking Back on 2018: Q4 Slippage
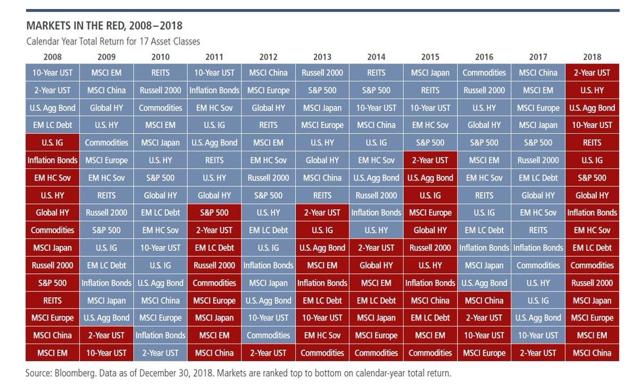
The market was entirely red for 2018. The best performing metric was inflation, and the 2-Year US Treasury. MSCI China was the best performing metric for 2017, and the worst for 2018. In fact, the Top 4 performers during 2017 all fell to the bottom of the return table for 2018.
Source:
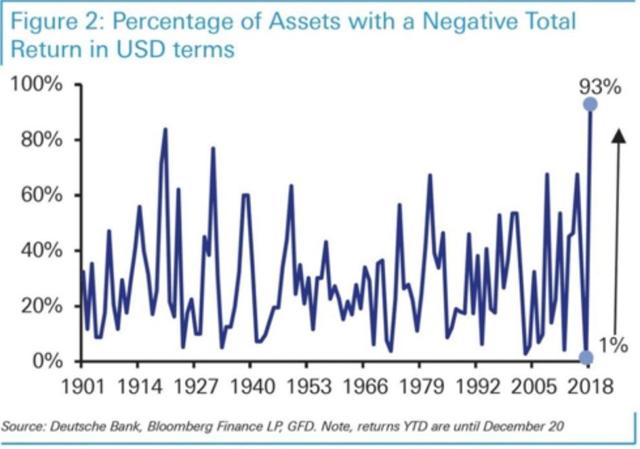
93% of assets had a negative total return during 2018, which was the worst performance in a very long time. CPI posted a 2.5% gain, but gold, the hedge fund index, real estate, and all the investment styles did not survive the end of year carnage. The worst performer of the year was Emerging Market equity, declining by a cool 15.9%. Developed markets were close behind, posting a 13.8% loss for the year.
Source: StockTwits
Based on it's YTD 2019 performance, the market doesn't even remember December of 2018. The S&P 500 is up 9.73%, the NASDAQ is up 11.75%, and the Dow Jones Industrial Average is up 9.28%.
The Effect of the Government Shutdown
The stock market has been churning upward, without much economic data to drive it. Several key economic reports have been delayed since the shutdown, meaning that the Fed had to make their most recent decision without a lot of recent data. Retail inventories, home sales, trade balance, and business inventories have all been delayed, to name a few.
Several models have also reflected this potential slowdown, with some factoring in the probability of a recession over the next 12 months. Nordea Bank found that there is a 49% likelihood of a recession in the next 12 months, based on the differential between expected consumer confidence and current conditions.
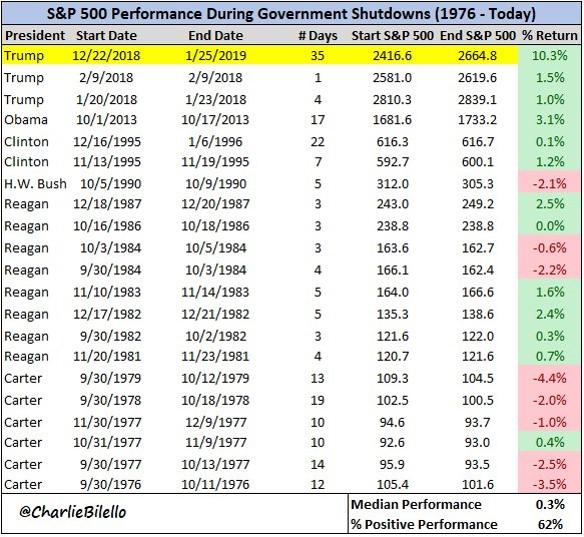
Source: Charlie Bilello
But the market has trucked onwards and upwards, delivering a 10.3% return over the 35 days that the government was shutdown. That type of performance is definitely an anomaly, and it is uncertain if the same movement would occur if the US government shuts down again.
The Earnings Recession
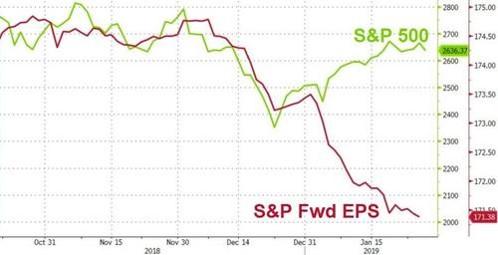
Several notable companies have lowered their earnings guidance. Apple was a prominent player in that announcement. They still managed to jump 5% after their 0% earnings beat. Samsung, LG, Delta, Skyworks, Ford, Nvidia, and Caterpillar, among many others, are all in a similar situation. Forward EPS estimates for the S&P 500 have dramatically decreased since the end of December.
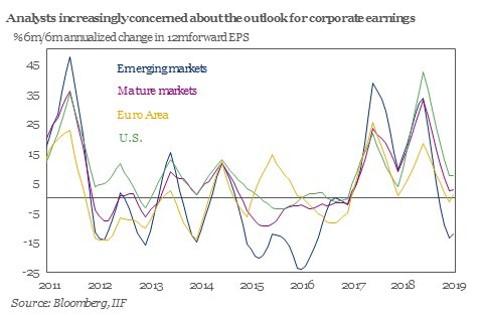
The earnings compression process is not unique to the US. Emerging and mature markets, as well as the Euro Area, are in the same boat. The outlook for corporate earnings does not look bright.
Source:
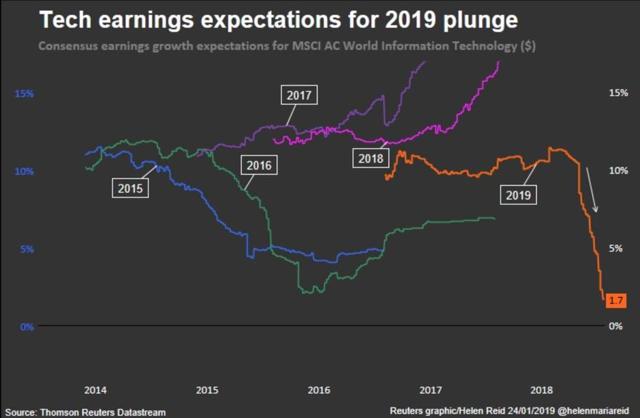
Tech expectations have also declined. 2019 earnings estimates are at 3.4% growth, as compared to 2018's 6.1% growth. Tech is a big driver of the rest of the market, composing 19% of the S&P 500, so what happens in this space matters for total index performance.
Source:
Sales and EPS growth is expected to contract after Q1 2018. EPS growth was 31.25% for the first quarter of 2018, and sales growth was 10.31%. Both of those metrics have declined steadily since then. For firms that have reported, EPS growth was 17.83% for Q4 2018 and sales growth was 6.03%. S&P 500 earnings are expected to decelerate into 2019, and into the beginning of 2020 as well.
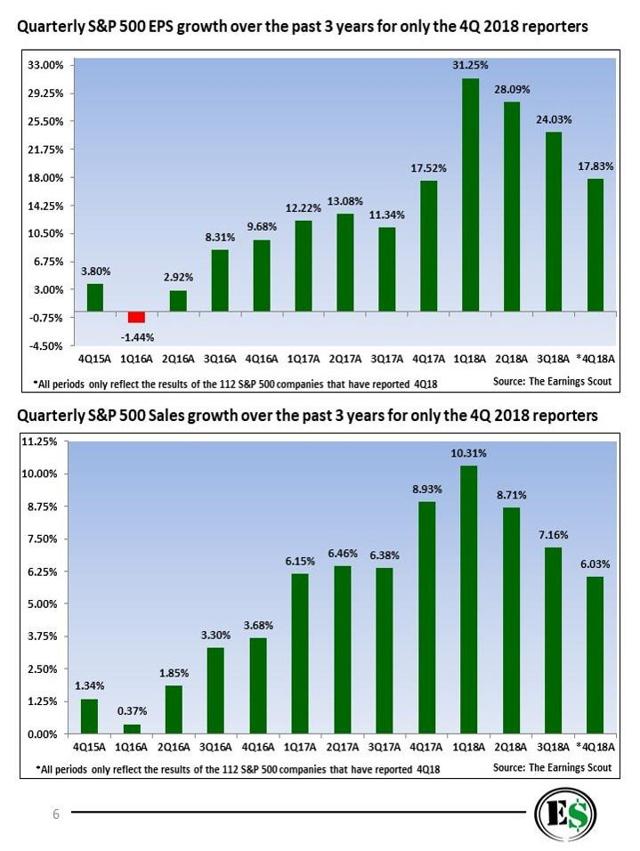
Source: Earnings Scout
Despite the 2019 rally, or because of the 2018 downfall, people are still pulling their money out of equities. The risk tolerance of this market is low. Regular investors are not back in the market, and this bounce is primarily due to low volume and a panicked plunge protection team. People are afraid of a downfall in the market again, and all the data points discussed above contribute to that fear. Outflows are a lagging variable, but it's important to consider them in an overall analysis.
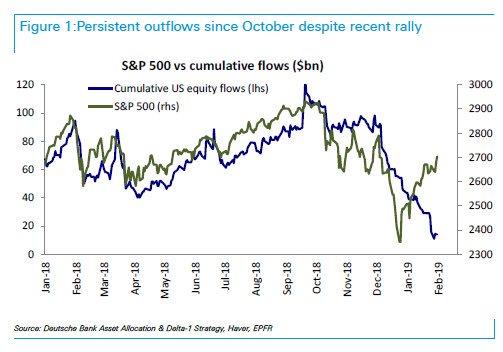
Source:
Conclusion: The Market Does What the Market Does
2019 will be an interesting year for the markets. The bears had a great month at the end of December, and the bulls have been thriving year to date. Regardless, there is a lot that the market has to process with regards to economic data, especially the delayed reports, and the trade war negotiations.
However, it could be arguable that the market will continue upwards regardless. Housing data, manufacturing data, and other hard reports haven't been great, but that really hasn't moved the market that much. Consumer sentiment has contracted, but that would be impossible to see in the current market returns.
The gap between the high and the low will continue to test investors, but it's important to just stay the course. Market cycles are normal, and are to be expected. Right now, equities are still relatively beat up from their December fall, and could potentially be a good buy.
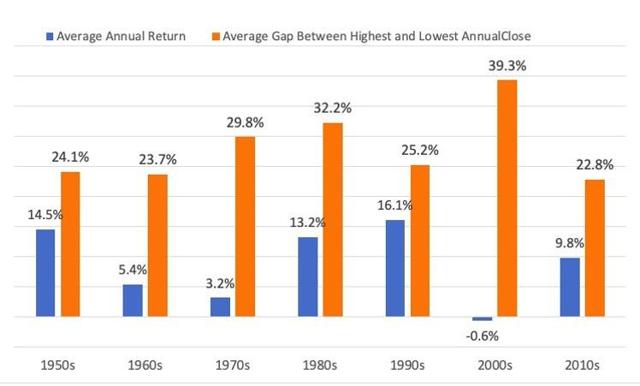
Source:
Regardless, patience is key. We can look at all of the above indicators and let that determine how we allocate our investments. But over the past five years, the market has trended upwards. It hasn't hit peak value since the December 2018 drop, but if you had invested in a broad market index in early 2014, your portfolio would be up by ~36% in value. If you had invested twenty years ago, on the tip of the tech bubble, your money would have returned ~40% and 102% with dividends reinvested. If you had invested on January 1st, 2019, your portfolio would be up 9.73%.
It is not wise to ignore economic data entirely, but the stock market drifts upward 53% of the time. Investing for the long haul, especially in a broad market index and reinvesting returns is one of the easiest ways to take advantage of market mechanics. In conclusion, things are slowing down and looking tough, but remaining in the market is key to success.
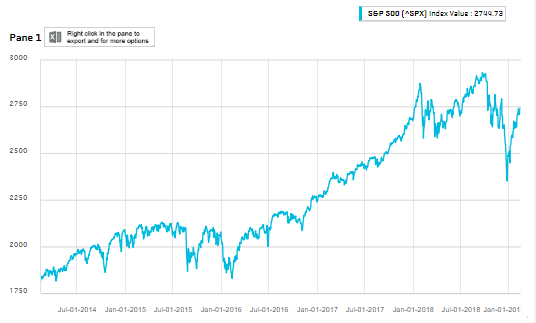
Source: Capital IQ
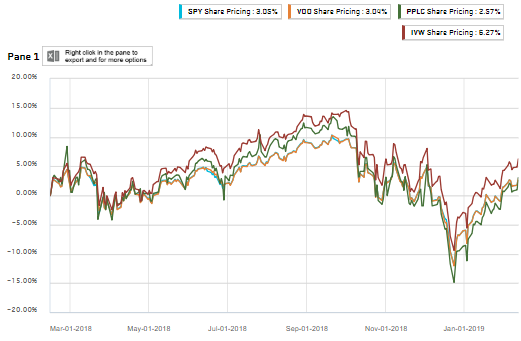
Trade Ideas: Getting Exposure to the Broad Market
The SPY ETF is the most basic way to get diversification to the broad market, and get exposure to all of the movements. Vanguard also has the VOO, offering a 0.5% lower expense ratio than the SPY, which is important over a longer term investment horizon. The SPY is more liquid than VOO, and operates as a unit investment trust, so investors can avoid capital gains.
There are also leveraged funds, such as the PPLC, that trades at 1.25 leverage as compared to S&P 500, creating 125% exposure to the broad market. It has a higher expense ratio, but when it does well, it does really well. Finally, IVW gives a heavy weight to the outperformers, taking advantage of earnings and sales growth and momentum It is also more expensive to trade, but has outperformed the other indexes over the past year.
Source: Capital IQ
Disclaimer: These views are not investment advice, and should not be interpreted as such. These views are my own, and do not represent my employer. Trading has risk. Big risk. Make sure that you can ...
more

